Important Update: LAST CHANCE
To continue delivering high-level crypto insights, we’re making some updates:
Weekly market outlooks like today’s post will now be subscription-only at $399/year ($49/month) for actionable insights, key dates, and trend analysis.
Current $2,200/year members will be upgraded to Founding Member status at no extra cost.
Last chance to lock in the $2,200/year Founding Member rate before it increases to $2,800/year on March 28, 2025.
These changes let us go deeper, deliver more value, and build a stronger community of serious investors. Subscribe and join thousand of investors getting market beating insights every week
Today, I’ve got key insights into time and price that point to one thing—a major rally is setting up.
It’s been a slow grind for the past month, but now is not the time to check out. We’re hitting the culmination of the 60-month cycle from the COVID low this week. That’s a monthly cycle, not a daily one, which means patience has been required—but the payoff is coming.
On top of that, we just crossed a crucial seasonal shift with the vernal equinox. This has marked key turning points in markets before—last year, it nailed the BTC top; this year, it’s shaping up to be a low.
Today’s report lays out why both stocks and crypto are at their biggest inflection point since COVID. Sentiment, cycles, volume, fear, and news are all converging. Everything is lining up—so get ready to trade.
SPY
First, let’s take a look at the stock market and why the current sentiment and fear is coming to an end.
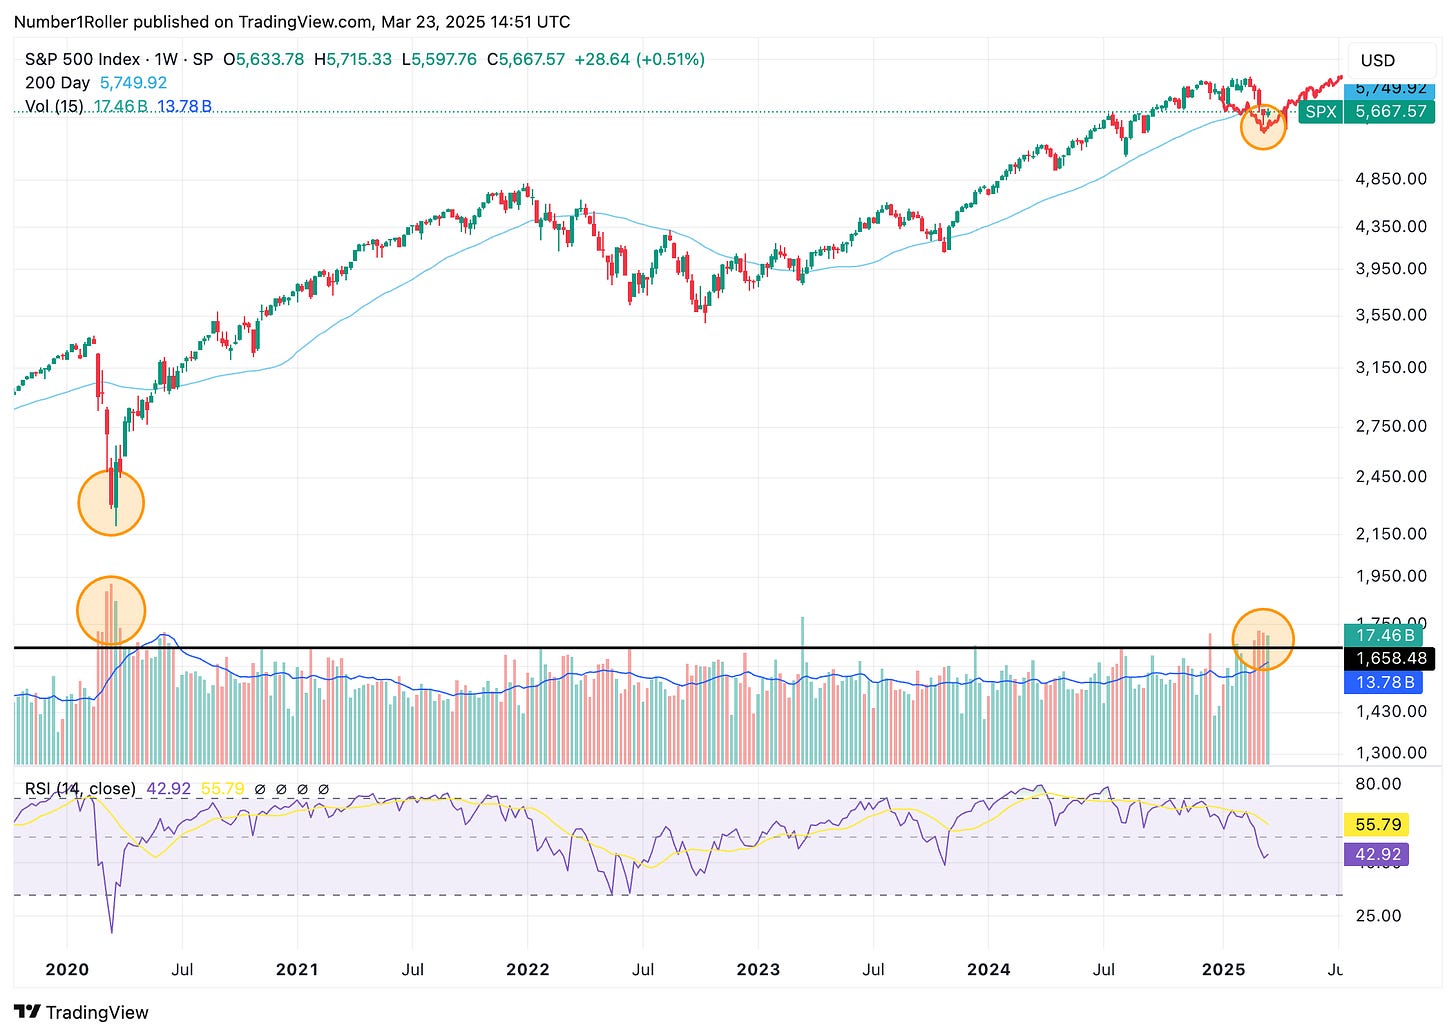
Below I want to highlight the SPX weekly chart and the volume.
Gann said in his work that volume equals force. When you get a major culmination of a move in a market you get huge volume. Either the buyers are forcing the price up or the sellers are forcing the price down.
In this case if you look at the weekly volume of SPY you can see that it has not had this level of sustained weekly volume (above the black line) since the covid low.
That’s a lot of force coming into this market 60 months from when it last showed up.
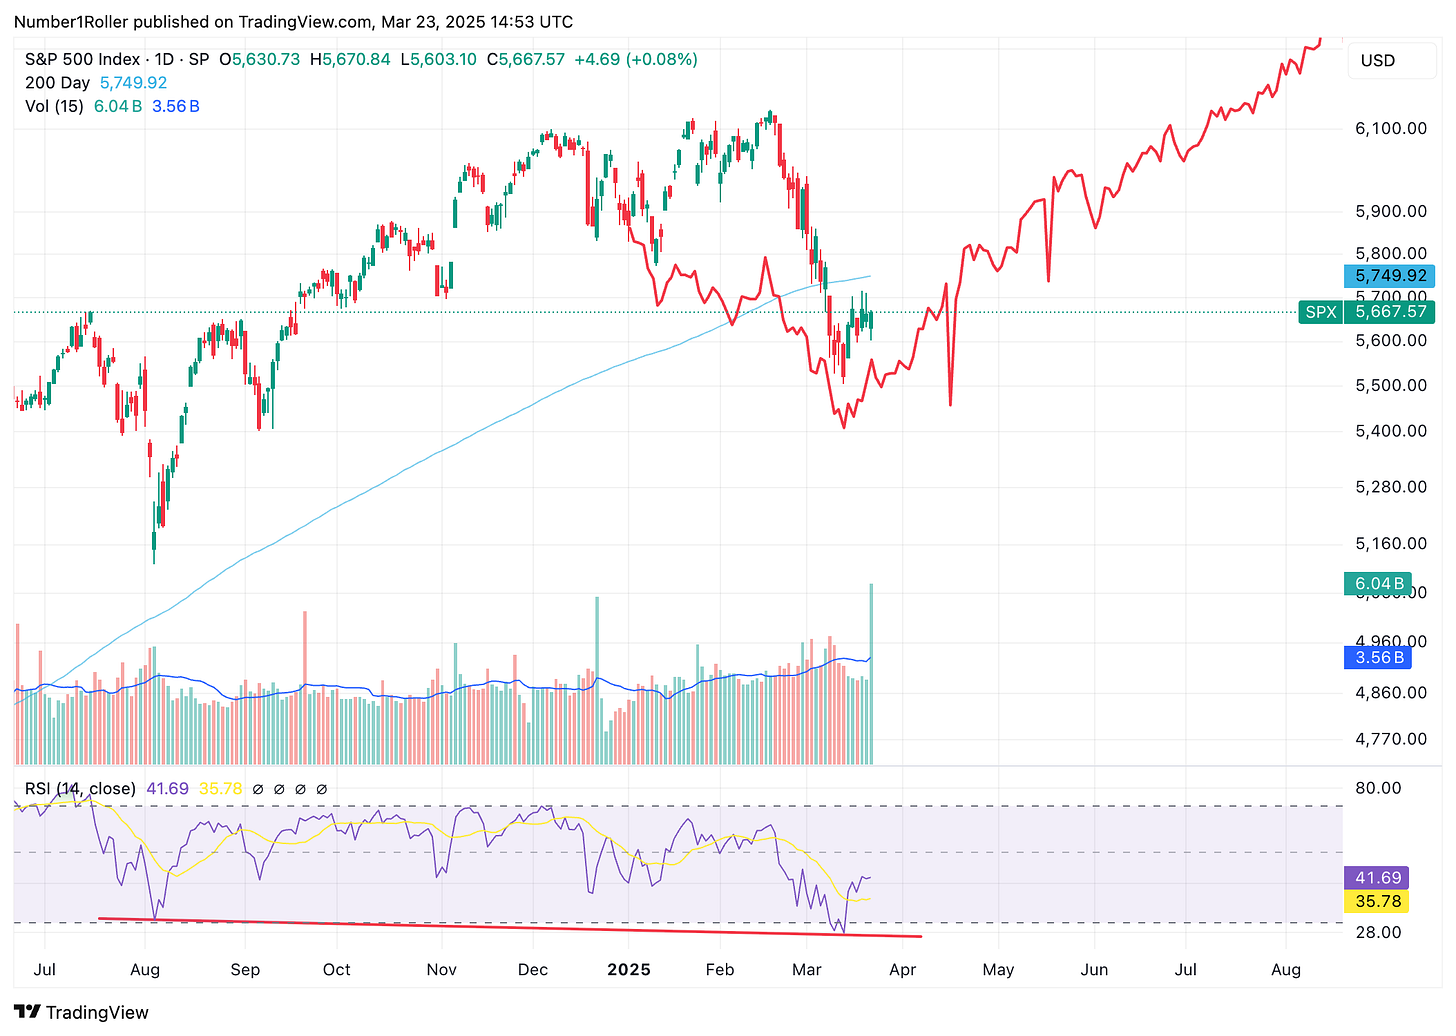
Additionally, we continue to track the daily time relationship to the 90 year cycle as you can see below.
A bottom or a low again came in right on time with the 90 year market. Now we can see the major RSI bull divergence on both the daily and weekly chart above.
This cycle suggests we have a slow week this week but also the beginning of a big move.
Time
Once again our time factor are in play and sure enough we get some emotional news to go right along with it.
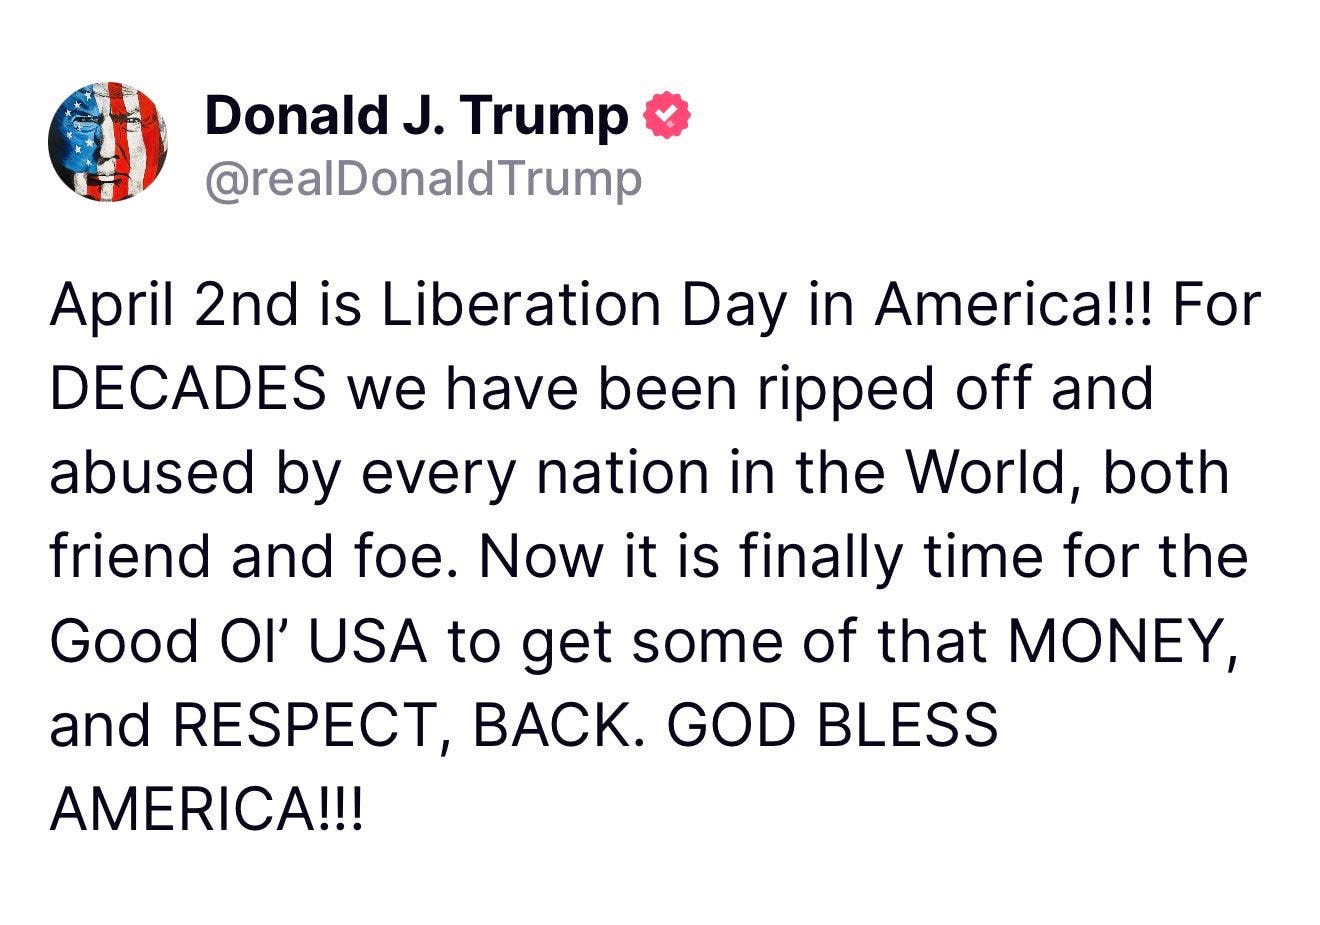
Trump is touting April 2nd as a huge day for America. I guess that’s when the majority of tarriffs will go into effect.
As we stipulated weeks ago this is likely a sell the rumor buy the news event. Given the time factor aligning with this news and the price action into it I’d imagine this will help form the low in the markets.
The markets will then start looking forward again 6-12 months where it will seem like the worst of the trade war news is behind us and better conditions lie ahead.
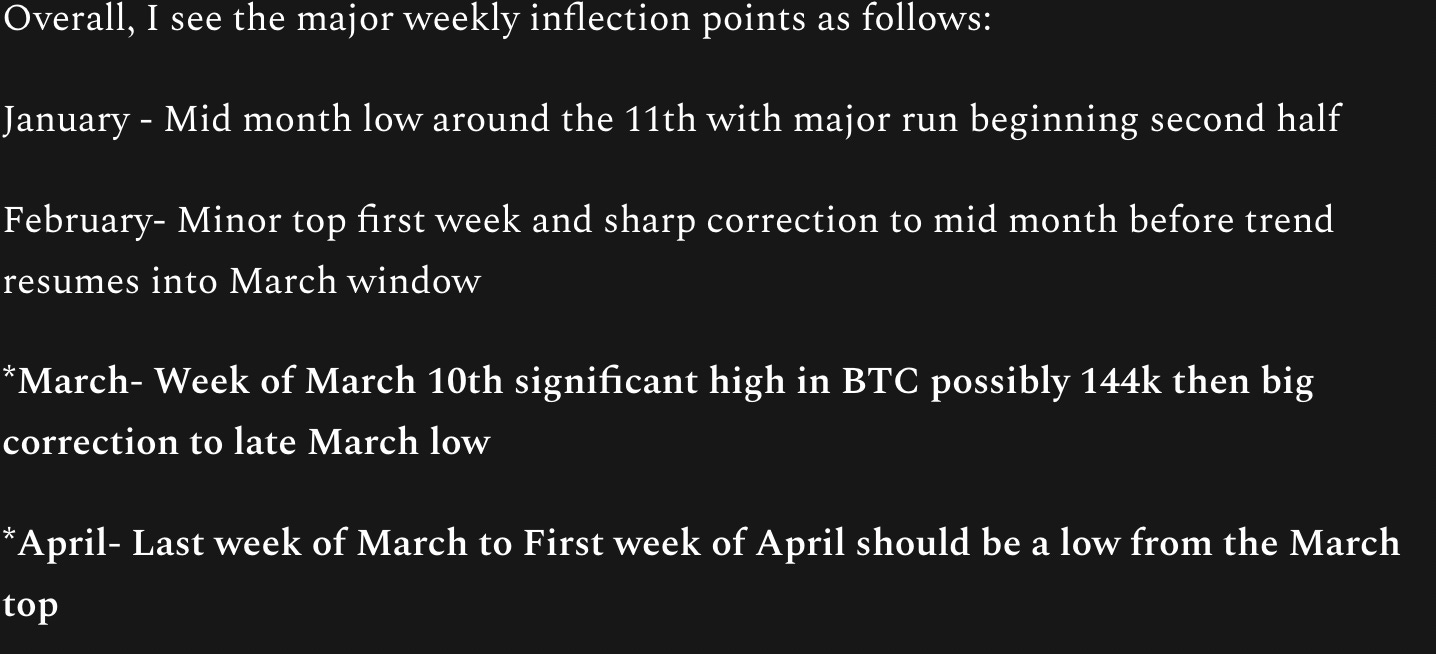
This was all part of our annual forecast which you can see below.
This forecast was specifically for BTC and although it has been wrong price wise the time was always the more important aspect of it. So far it hasn’t been too bad timing wise as you will see below the recent BTC low came in right on time we called for three months ago.
Now we are approaching what may be an even more key date here in the last week of March and first week of April.
BTC
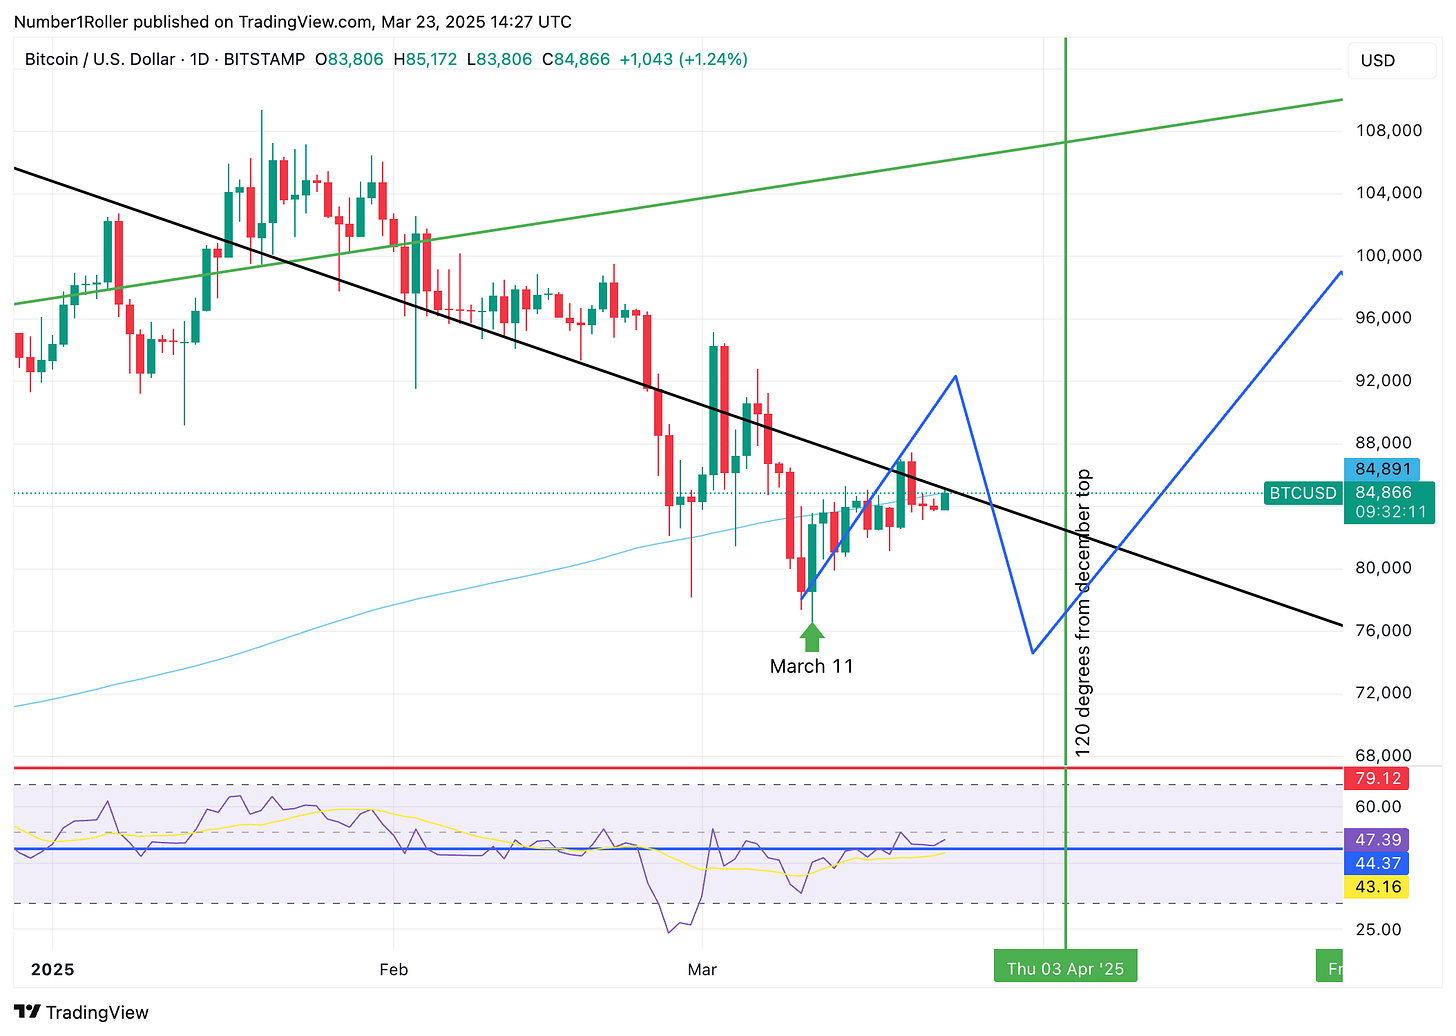
Looking at the daily chart for BTC below.
You can see that the low has come in ONE day out from our forecasted date in three months. Again not directionally correct but thats because we are dealing with an inversion cycle. No problem we still have the dates to respect.
That said, we are approaching the next important time factor which may look to be a sort of double bottom or close to it. It will be the 120 time cycle from the top and may prove to us that the market is working off the triangle cycle a bit more strongly than the square.
The other thing that may surprise many people, and what technical analysts don’t understand, is that BTC has YET to put in a 3 day reversal against the down trend. Thats over 60 days without three straight green days.
It may not seem like much but it just goes to show Gann’s techniques are still very much in effect today no matter the market.
It’s a simple simple cue yet it so powerful in realizing where and when bottoms start to form. So continue to be on watch for that overbalance of time to be our next sign of a changing market.
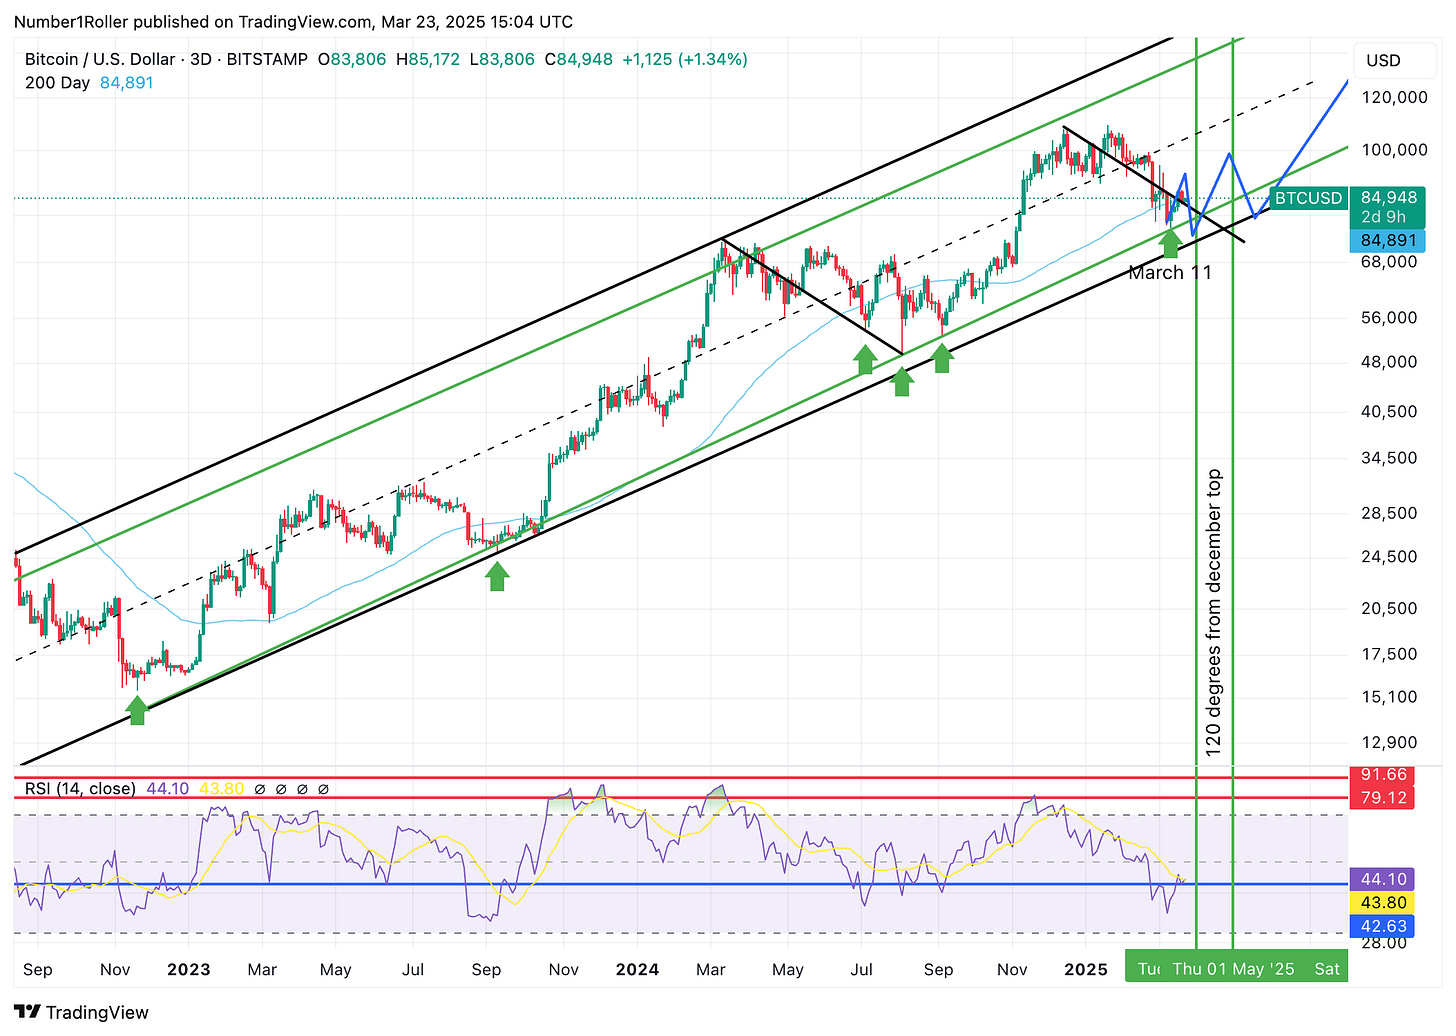
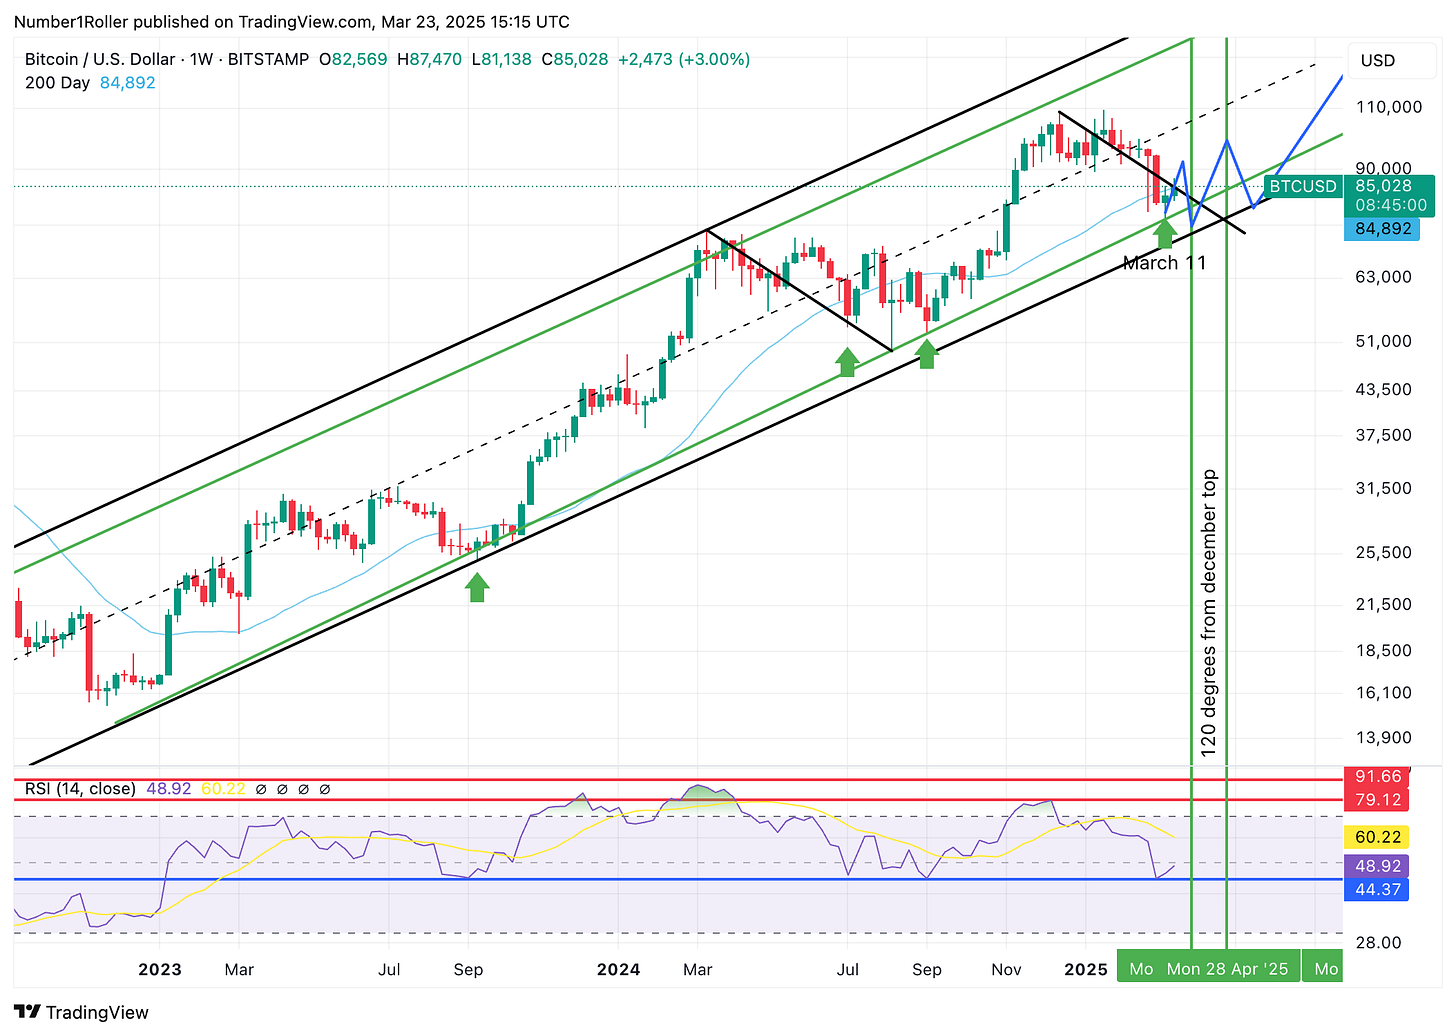
Now, let’s turn towards the more major trends of the three day and one week charts.
What I want you to look at on these images is the RSI and the levels I have marked with the lines and how they correspond to major lows in this cycle.
You can see on the three day chart, below the blue line has been a major buying signal all cycle long.
On the weekly chart a tap of the blue line has been the major signal all cycle long.
Both the three day and weekly charts are telling us the risk to return is very favorable at these levels.
So I reiterate that this is definitely an accumulation period.
That said, I also reiterate patience as we can still see some swings lower. The 72k area remains my “all out aggressive” target if we get it. If not we are still using a strategy of slowly buying.
As I said we still have yet to see the 3 day reversal and on the weekly we have yet to see the major trend 3 week reversal.
Price wise the market should be getting stronger above $86,500 below it without a time overbalance caution remains warranted.
ETH and Copper
I want to highlight the relationship between ETH and Copper today as I think you’ll see these two assets have shared a high correlation.
Those of you who follow the 18.6 year real estate cycle know better than anyone that a key sign of where we are is copper prices. Copper is the commodity that forms the backbone of construction and power.
When copper is roaring that usually means construction and electrification of things are under full swing.
Similarly, one could argue that if BTC is like gold and a “store of value” than ETH is more comparable to copper in that it is the backbone of a roaring on chain economy.
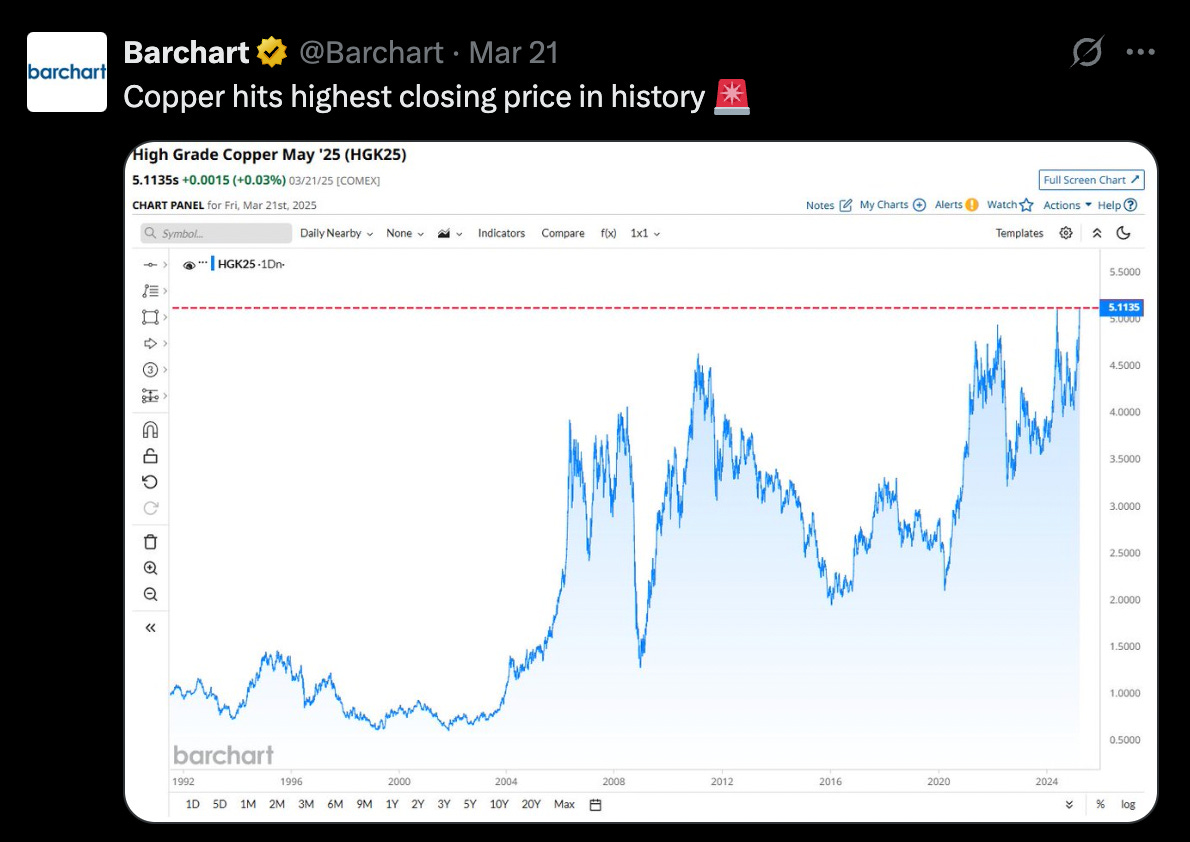
Just last week copper broke out to a new all time high.
But here is where it gets interesting. I have been studying the relationship of copper and ETH for some time and as you’ll see below they are highly correlated in price and time.
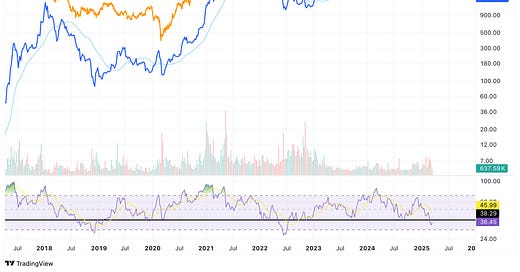
Below is the price of copper in orange from its 2017 top to today, overlaid on the current ETH chart in blue.
I put Copper mirroring the price instead of directly over the top of ETH as I think it makes it easier to see the relationship.
As you can see these two assets have traded nearly in lock step with each other since ETH has been around.
The periods with the red arrows are where the cycles have inverted from one another. That is what we are seeing today a large cycle inversion.
It’s hard to say whether or not one follows the other based on the price action but what we can infer is that when there is a deviation from one or the other they usually revert back to the mean. In today’s case, ETH has some catching up to do if this correlation is to stay in tact.
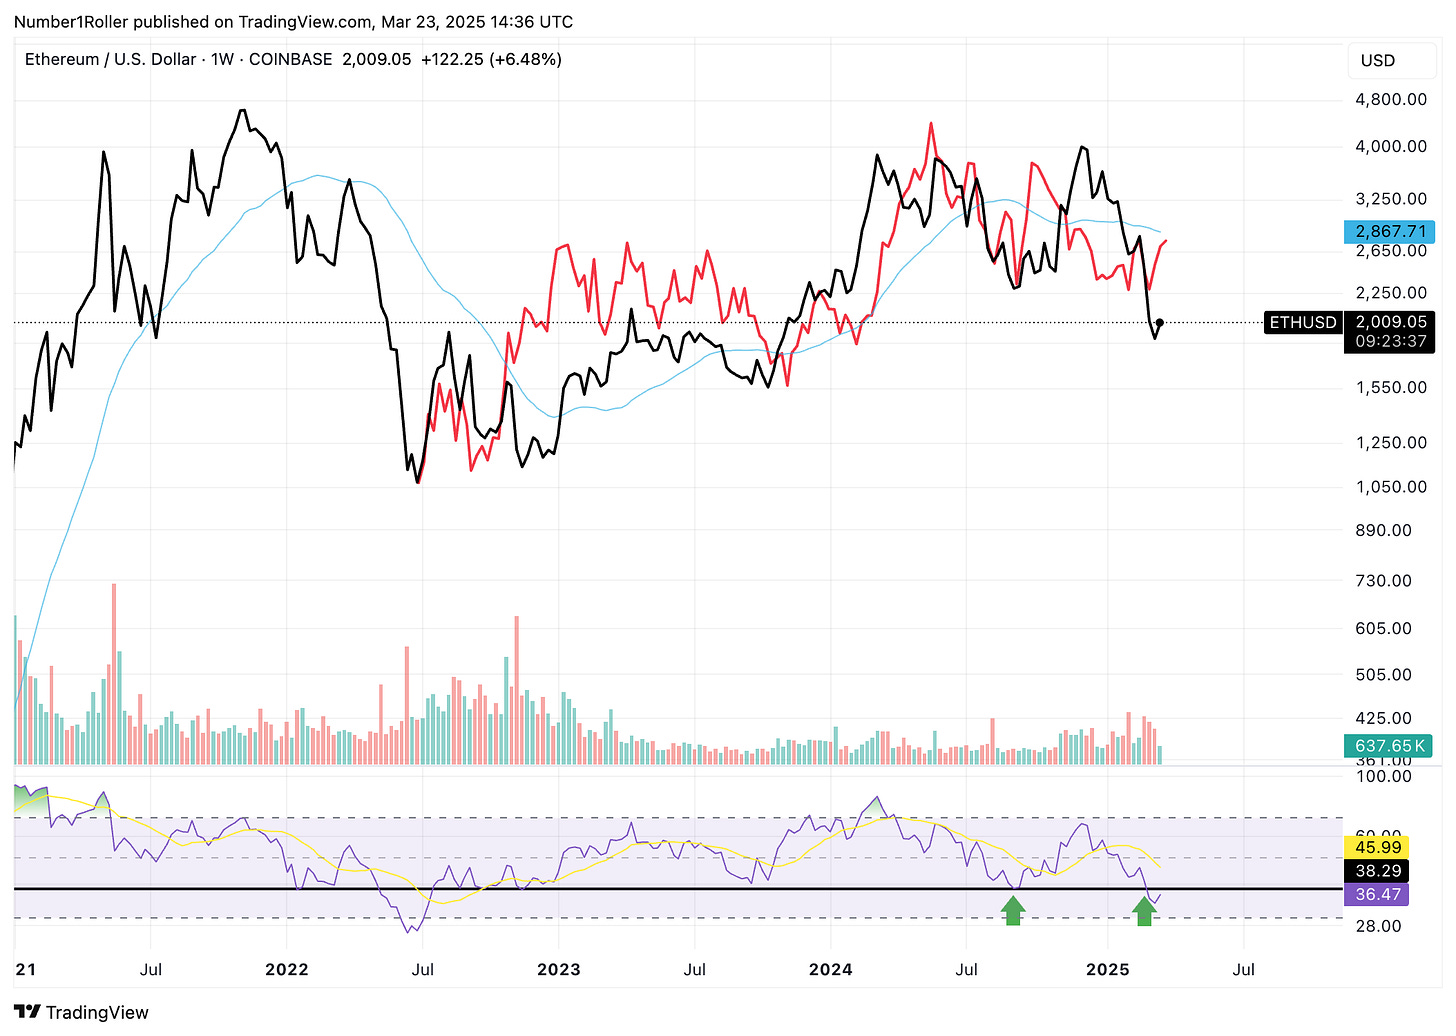
In another comparison we can look at ETH as it relates to COPX which is the global copper miners ETF.
As you can see above, COPX is in red and ETH is in black. Again, a very close relationship appears between these two assets.
What’s interesting about COPX is it’s almost even more similar to ETH’s recent price action as it’s lagging the price of copper.
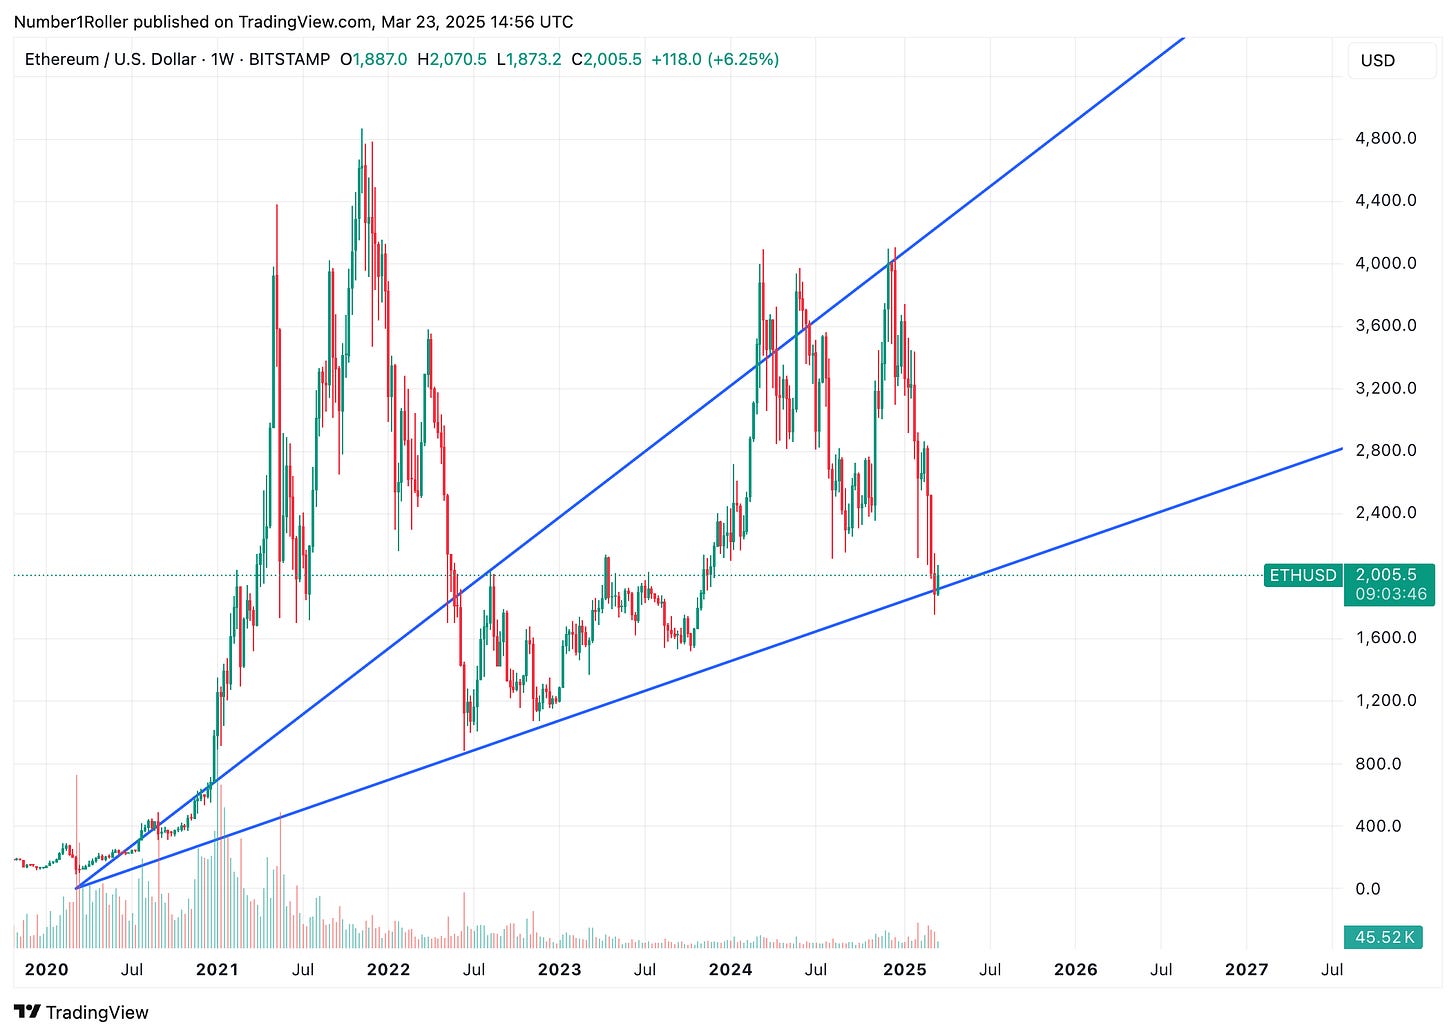
Finally, just to have a look at ETH on its own I have two key charts that show again how big this current low is.
First, the chart above is the Gann angles drawn up from the covid low. This 2/1 angle picked up the exact low from June 2022 and now cuts right through price today.
Below this angle the market gets very weak and will fall out of bed. Above this angle we still have a chance to make a rally.
Just another look that emphasizes the importance of this level that I have been highlighting for the last few weeks.
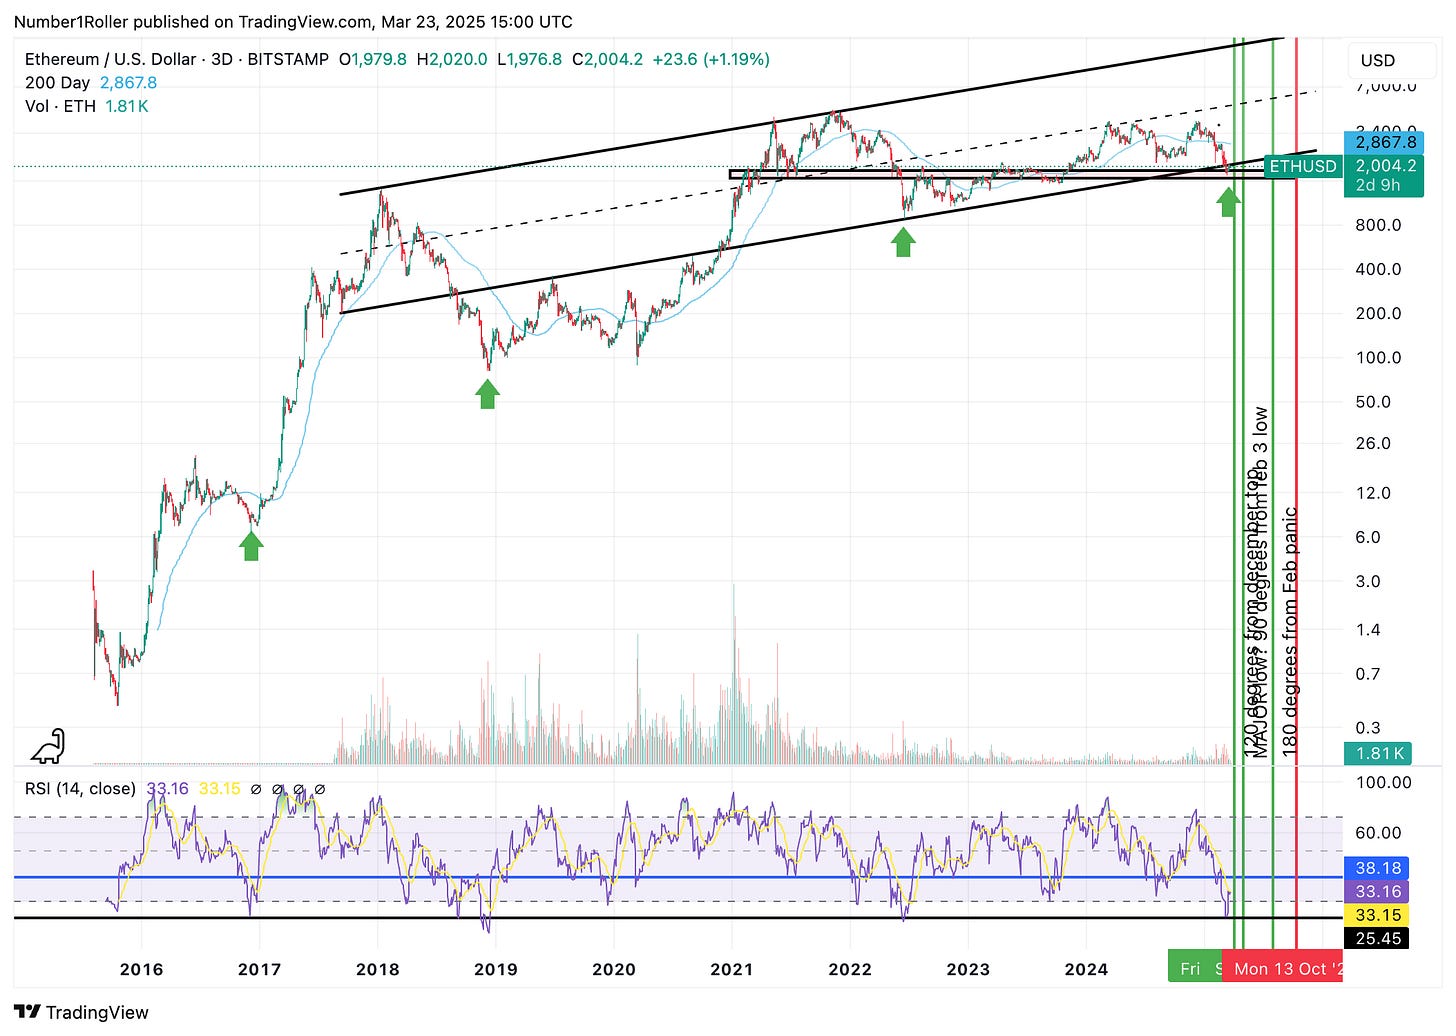
Lastly, this is the 3 day chart of ETH and similar to what I showed above in BTC your going to want to look at the RSI and the correlation to lows.
The green arrows indicate each occasion where the price of ETH was when the RSI hit the lower black line on the three day time frame.
I think you can see for yourself that these have been incredible buying opportunities in the past.
BTC.D
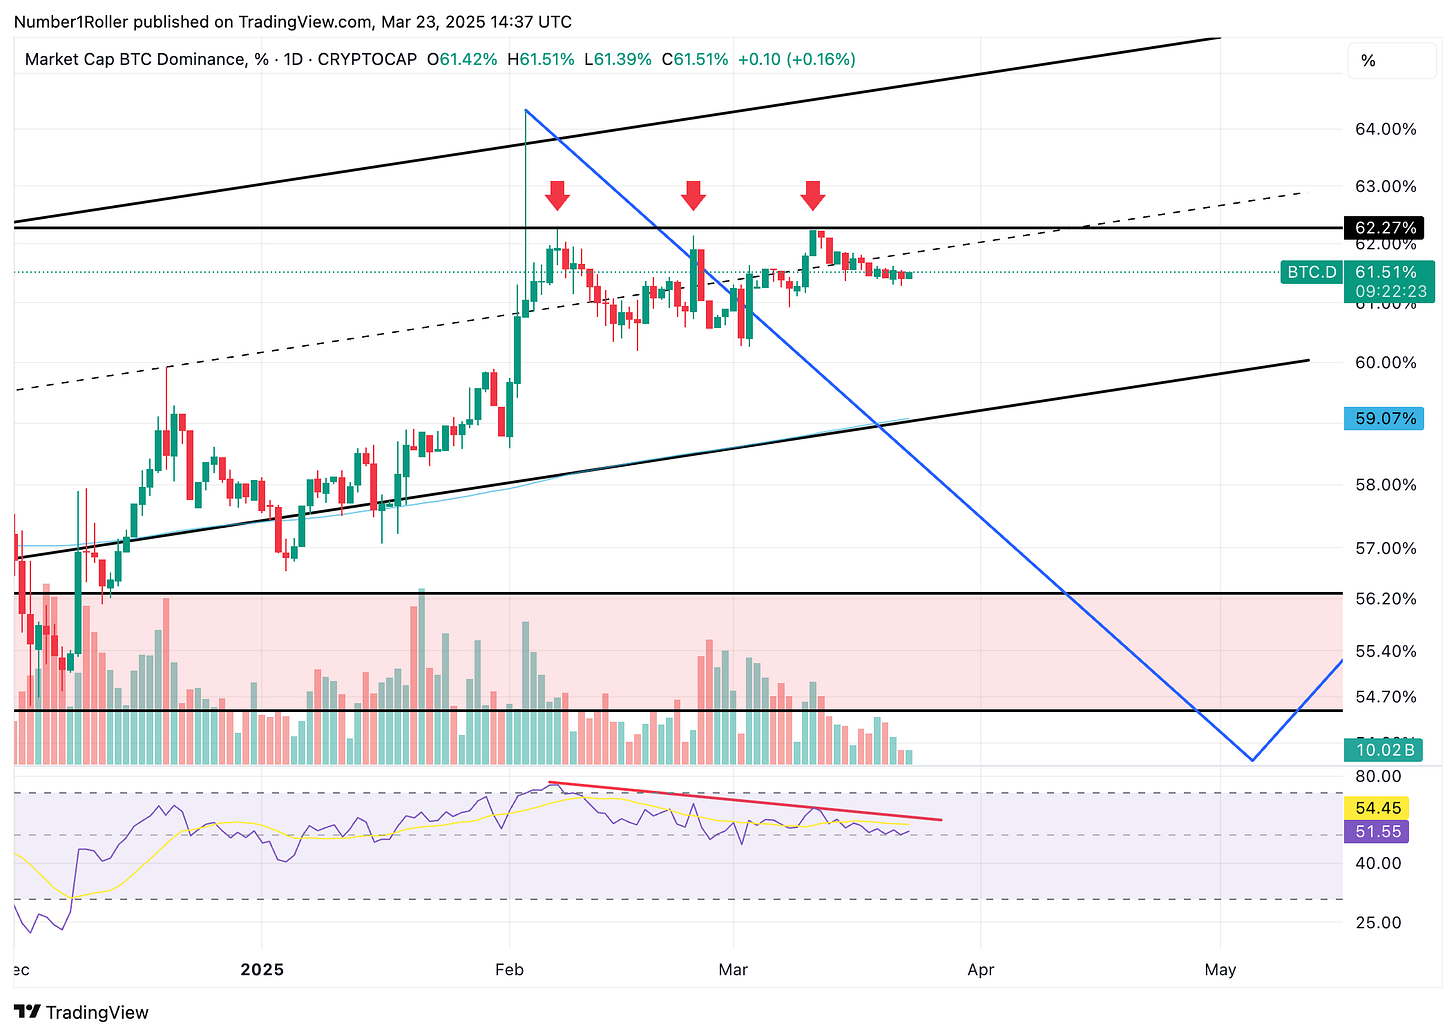
Finally, having a look at BTC.D
I am not going to try and predict this one since its just been to difficult for me to gauge.
However, it is worth keeping an eye on the current setup
To me it looks like BTC.D is struggling a bit to break over the level in black. It certainly seems to be flatlining and consolidating for a large move either up or down.
It hasn’t exactly had any overbalance of time in either direction yet so again maintain an eye on it and if it breaks down then we will likely get the big rally on ETH and ALT’s for at least a few months.
Conclusion
The message remains the same this week and that is patient accumulation. The markets are setting up to rally but it may take until early or mid April to really get going and confirm a low.
We have our key date in early April coming into focus next week. I expect this week may be a bit slow. Until then keep your eye out for that overbalance in time we talked about.
Fear is still high and force of volume is coming into the stock market keeping it right on track for a move higher in the cycle. BTC is pushing up but still needs to overbalance time and reclaim that 86.5k area for further confirmation.
ETH remains at a critical level but copper may be signaling to us a break to the upside is imminent if it is to stay correlated.
Finally keep an eye on that BTC.D chart as it will tell us if we are really going to hit an alt season or continue the slow grind of the cycle.
I highlighted some of the setups I currently like in alts and memes in our portfolios last week so make sure you see that. I am also going to be adding a few more alts to watch for accumulation on this week so get ready.

