It’s been a couple weeks since we covered the broader market and the underlying conditions necessary for the next advance to take place. After calling the lows in August and September it’s important for the market to confirm these viewpoints and that is just what we are going to show you here today. Confirmation of a new trend emerging.
But, before we get started I want to reiterate the importance of staying long in a bull market. Moves like these do not come around very often and it’s the big swings that will make you the most money but you have to have the patience, fortitude, and conviction to hang in there, not overtrade, and don’t sell out of your positions early. If you want to know the correct way to ride the trend and take profits we covered that in a special report last week that you can find here. Furthermore, I shared this important insight from a legendary trader in the book “Reminiscences of a Stock Operator.”
Now, if history and time are any indication of whats to come then it will be confirmed by the underlying conditions necessary. The conditions that are currently presenting themselves are that of a typical global risk on environment. We covered several of these key indicators back in Mid August where we got very bullish. Today, even more evidence is emerging of that trend.
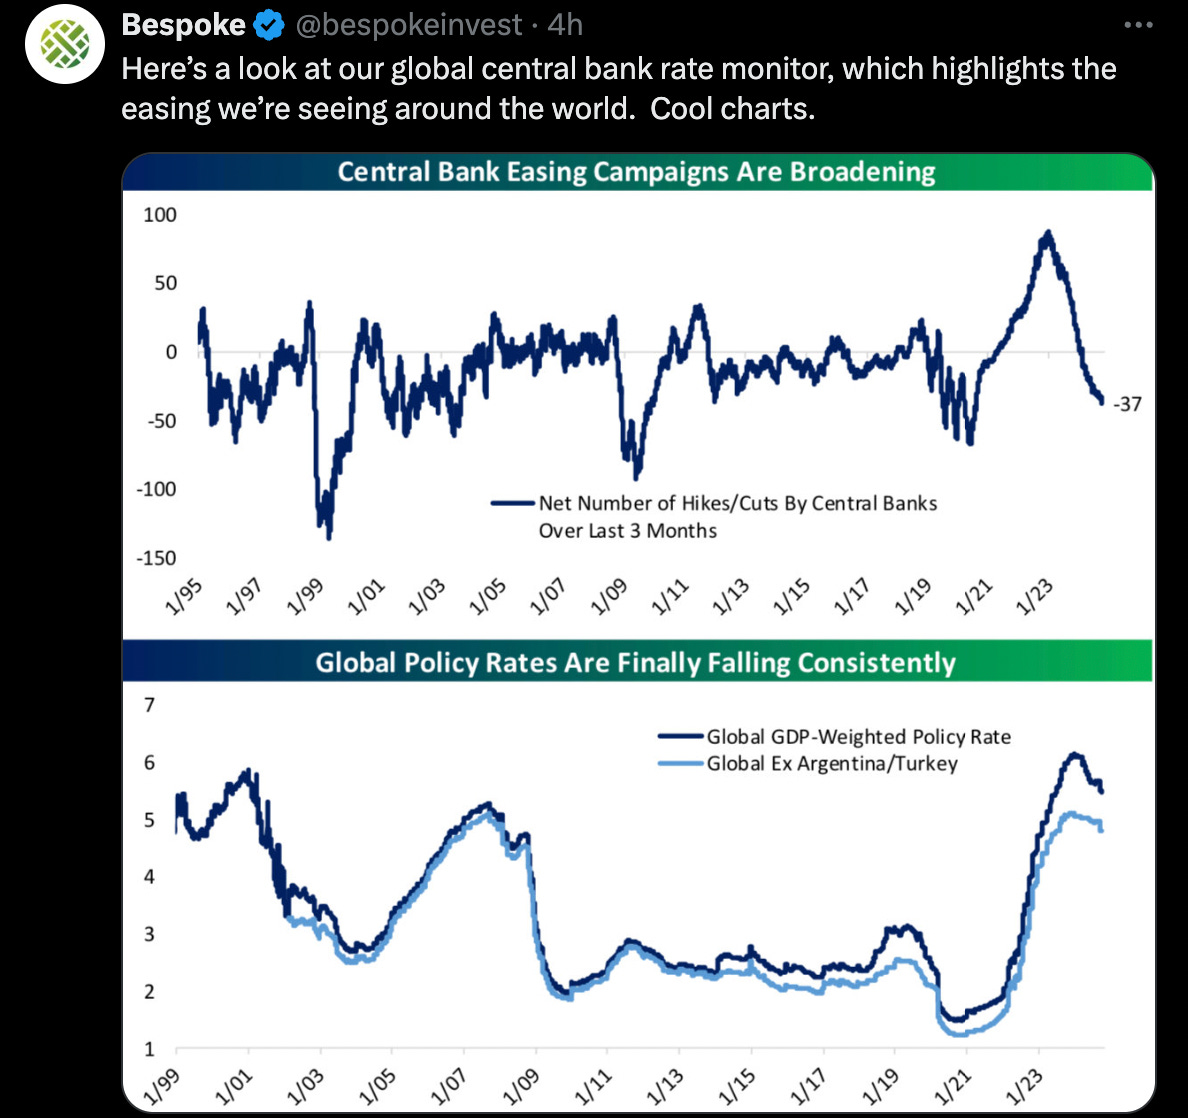
Just over the last month we have seen stock indexes break out to new highs both in the US and abroad. This is all coinciding with major central banks around the world broadening their easing policies.
Coming off one of the best September performances ever, in both stocks and crypto this is only going to add fuel to the fire. On a similar note, we are seeing several risk on indicators ramping up. These include the DXY falling below a major support level, the IWM small cap stock index making a new 52 week high while in a very bullish pattern and, the dealmaking on Wall Street making a comeback.
Now, this is nothing new or groundbreaking, we have been covering these developments for a while. But, what is new and groundbreaking is the massive Chinese stimulus package released just last week. In an effort to bolster their struggling economy they just injected the largest stimulus effort since the pandemic.
This had an immediate effect on their markets sending them from 52 week lows to 52 week highs in record time. It also has enormous implications on the Yuan and the Dollar not to mention the global liquidity picture. All of these charts we will cover below to show you how the macro risk on environment is shaping up.
Given our indicators and the confluence of cycles these developments were only a matter of time. Remember, we don’t know exactly what the news will be but it’s no surprise that these things happen to come out at the same time we forecast major changes in trend.
The one thing I am going to highlight in all the below charts (aside from the breakouts) is the time reversals we are seeing. I want to point out the 3 week overbalances in time. This is a simple signal but it’s a key sign of a changing market structure. Time will always be the strongest indication of a changing in trend. Most people do not understand this simple principle but that’s because they only look at price which keeps them guessing. Viewing time as the most powerful force in the market will give you a major advantage in staying ahead of the crowd.
Simply put, in a bull market the price will move up for longer periods of time than it moves down and vice versa in a bear trend. That is what we are going to show you in the below charts.
BTC
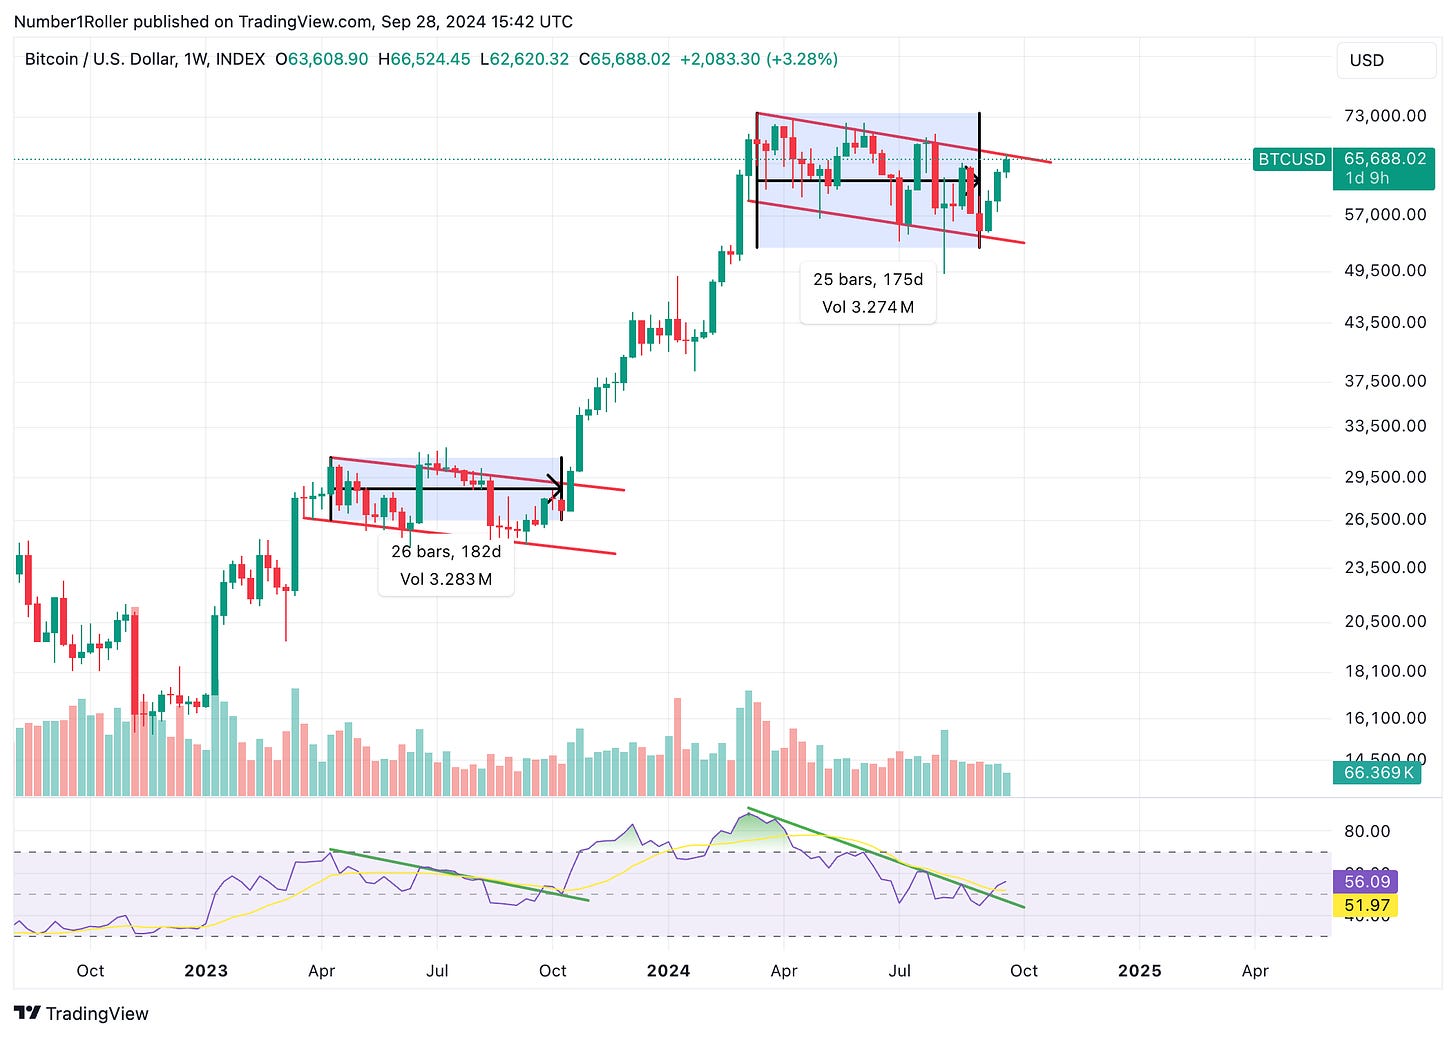
BTC is behaving right on schedule with our analysis. Notice the equal time frames from each of the ranges. If you look at the two ranges highlighted you will notice that they did not have one instance of 3 weeks consecutively green until the actual break out happened. That is where we are now. The entire time we have been in this range we have not had 3 green weeks in a row.. until now. Time is telling us here that the market is getting stronger by running up longer periods than it was running down. This overbalance of time is confirming the emergence of a new uptrend.
Additionally, the RSI breakout from its downtrend is notable and a repeat of the same pattern a year ago. To put the icing on the cake here we have made a higher high on the daily and weekly time frames showing us a final confirmation sign.
BTC.D
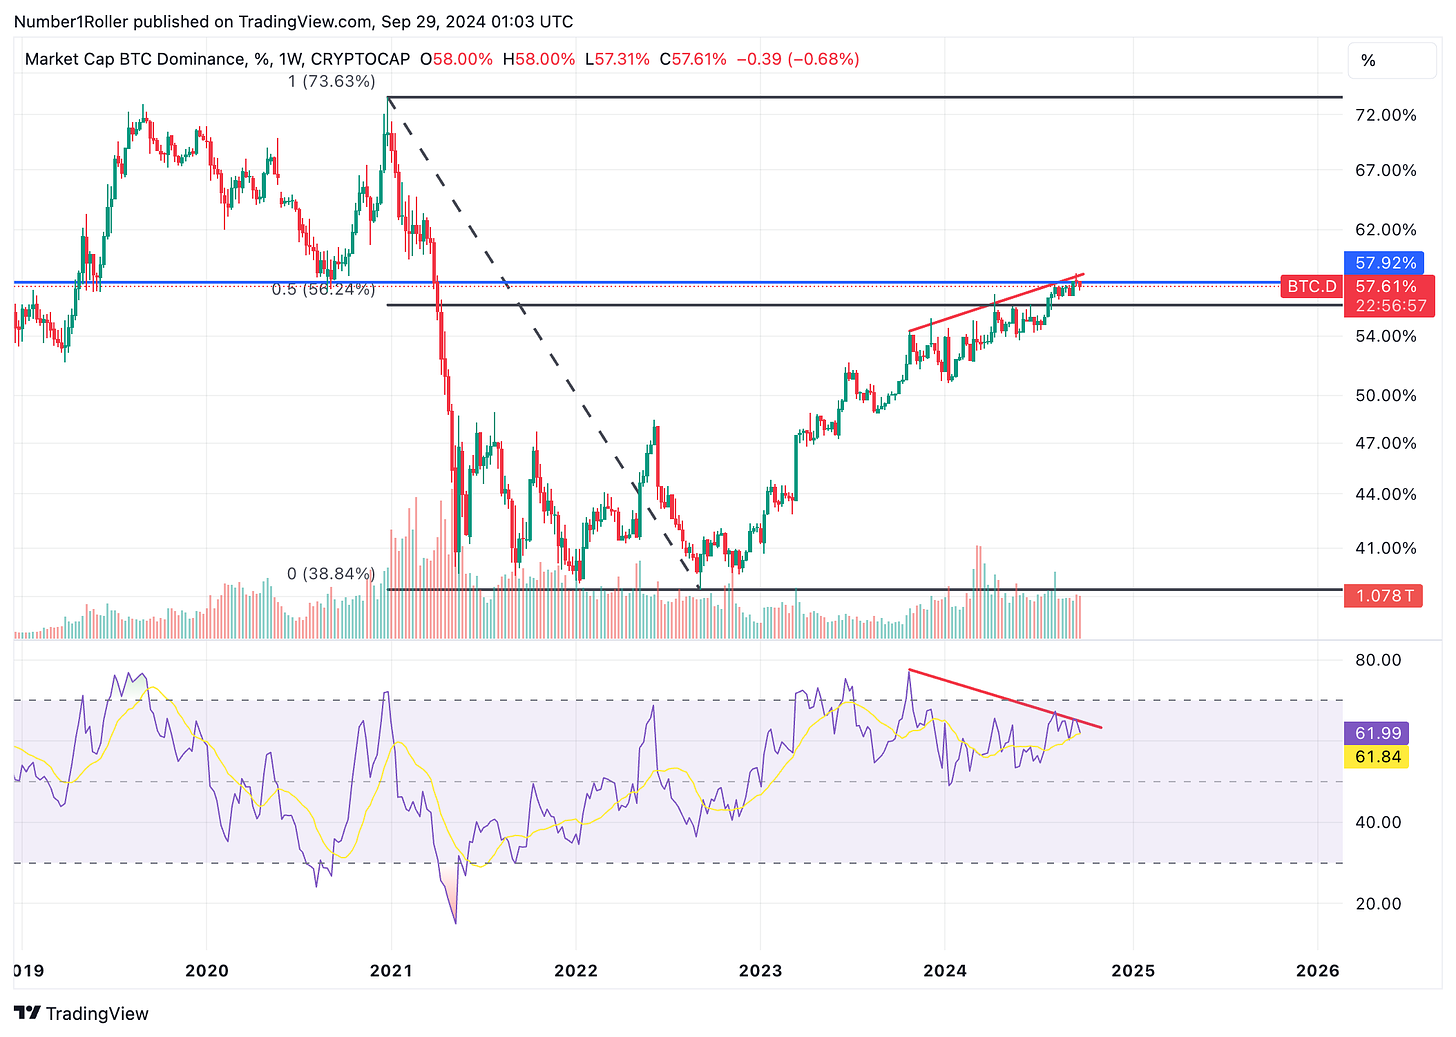
This has been one of the more tricky charts of this cycle but there continues to be mounting evidence of a reversal both with regards to this chart and ALT charts. While BTC.D has been stronger than previous cycles it is running on fumes. With a slight macro break in the trend and a push above the .50% retracement level it looks like it’s strong. However, the RSI and the blue line which is a major high time frame monthly resistance are showing signs of exhaustion. Last week also gave us a signal reversal candle as a warning that this move is running out of time.
ETH
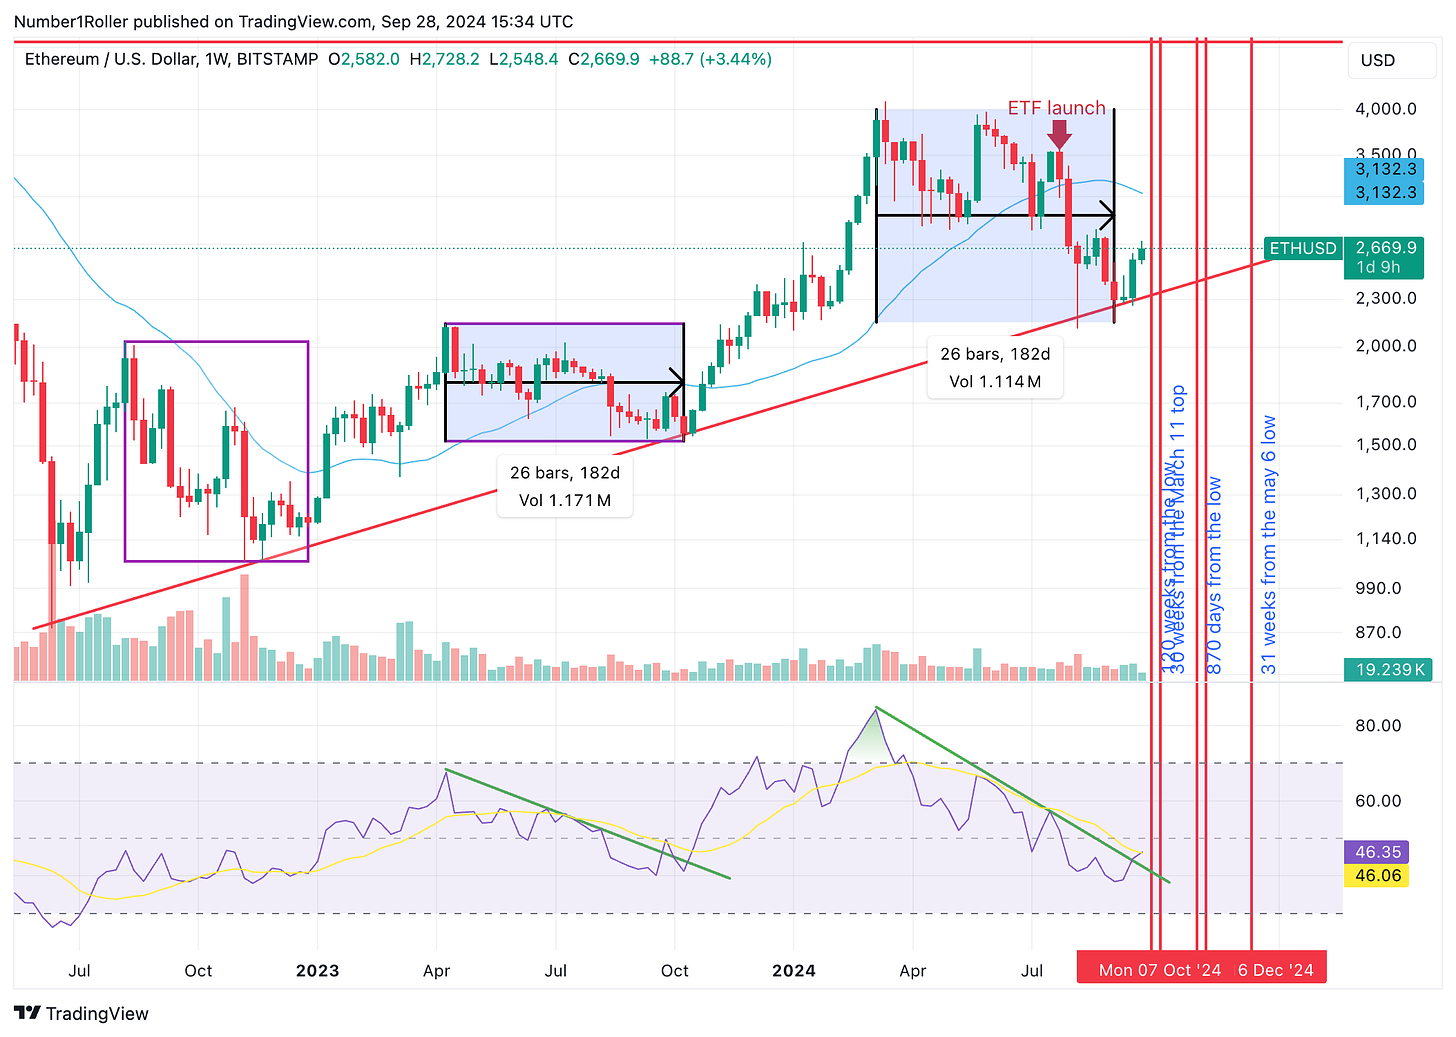
ETH is again showing us that the trend is changing here. Notice the highlighted ranges down. In each of these instances, we did not see one time where it went green for 3 consecutive weeks before the trend changed and broke out. Here we are now seeing that 3 week reversal in time along with an equal range in time and an RSI breakout very similar to what we see on BTC. The next step we would like to see here is a higher high being made.
TOTAL 3
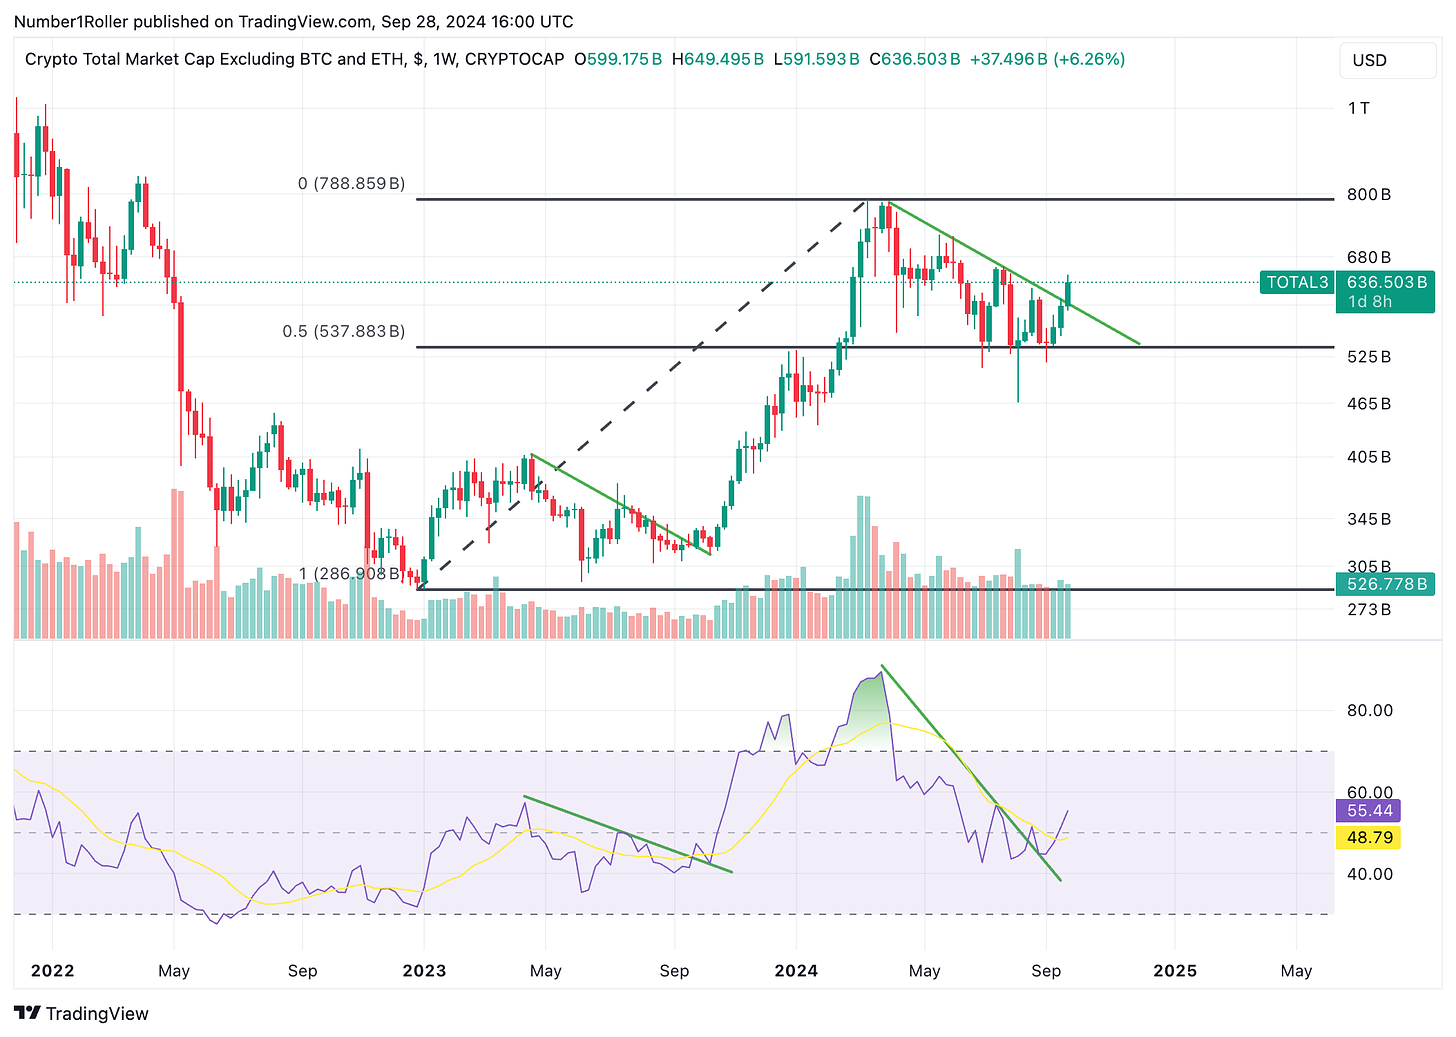
Total market cap excluding BTC and ETH is also demonstrating these same patterns. After holding its weekly closes above the major .50% level, notice how time began to overbalance running up longer than it ran down since the August 5 panic (3 weeks up, 2 down, 3 up). This is a notable shift in the behavior and is confirmed by the trend line breakout on both the price and the RSI.
TOTAL 2
Now for the total market cap excluding BTC. Again, this one is showing the same behaviors as the above charts but price has yet to get above that key resistance level most likely due to ETHs slow movement so far. Otherwise, we see the 3 week overbalance in time as well as the equal time ranges in a corrective wave. See again the previous correction of 26 weeks where, not on a single occasion did the market close 3 weeks green in a row. Once it did, that was the shift confirmed by the RSI breakout and a substantial run followed.
OTHERS
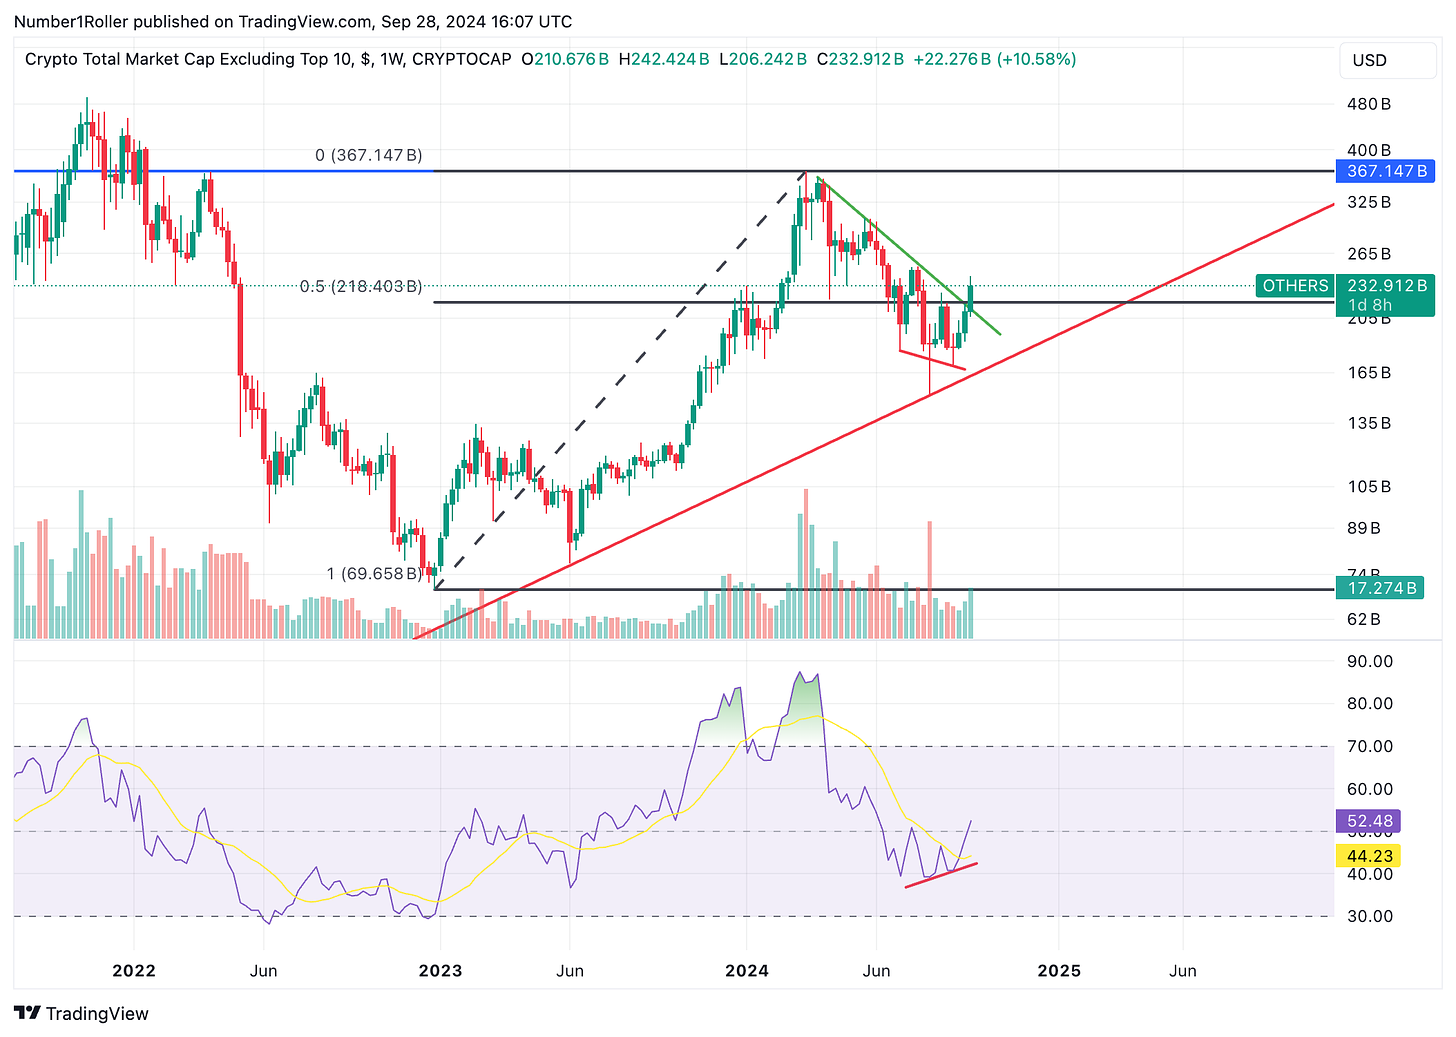
Lastly, the OTHERS chart just to really drive the point home. Look at the correction, and you’ll see not one time have we had 3 consecutive green weeks until now. Add on a breakout of the trend line and a reclaim of the .50% level and the market is telling us a shift is happening.
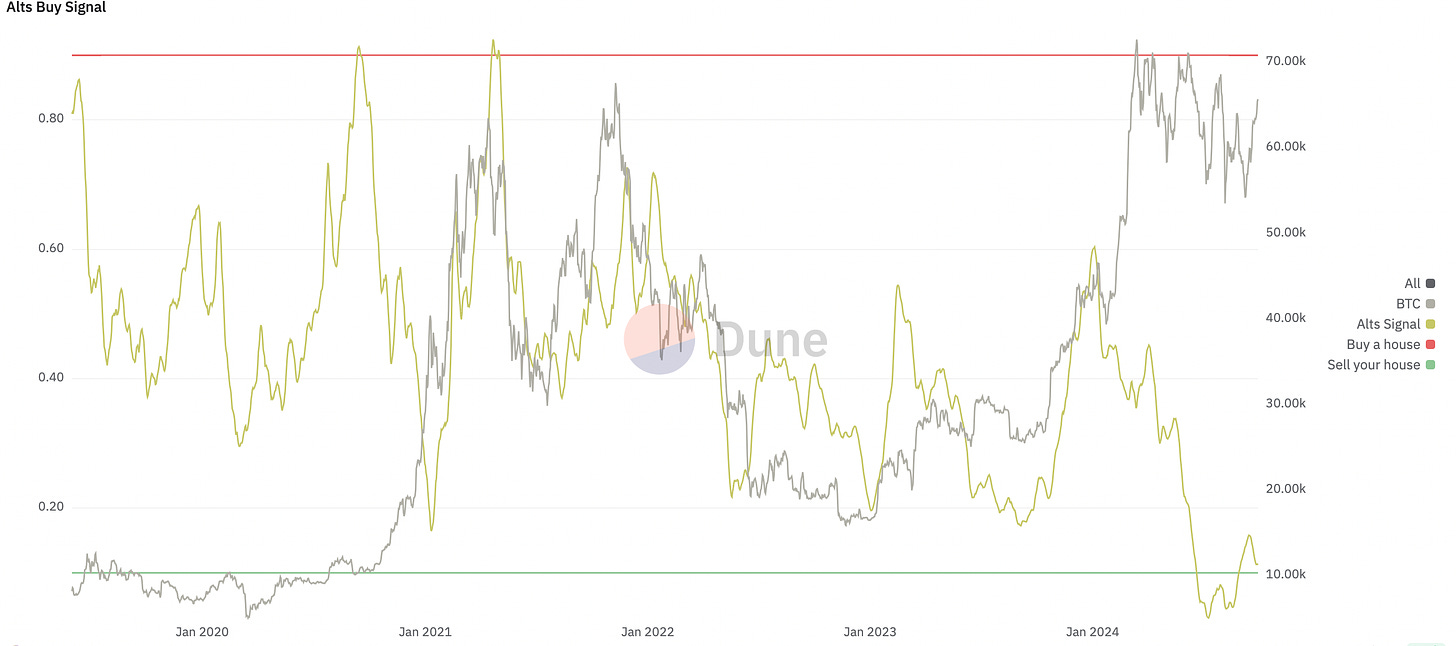
Additionally, our alt buy signal is coming off of its most oversold level since its inception in 2019. Meaning alts are at their most discounted level ever and are due for a rapid repricing. With a breakout off the low and a higher high being made this retest should confirm a second bottom out and a major green light to the market.
DXY vs YUAN
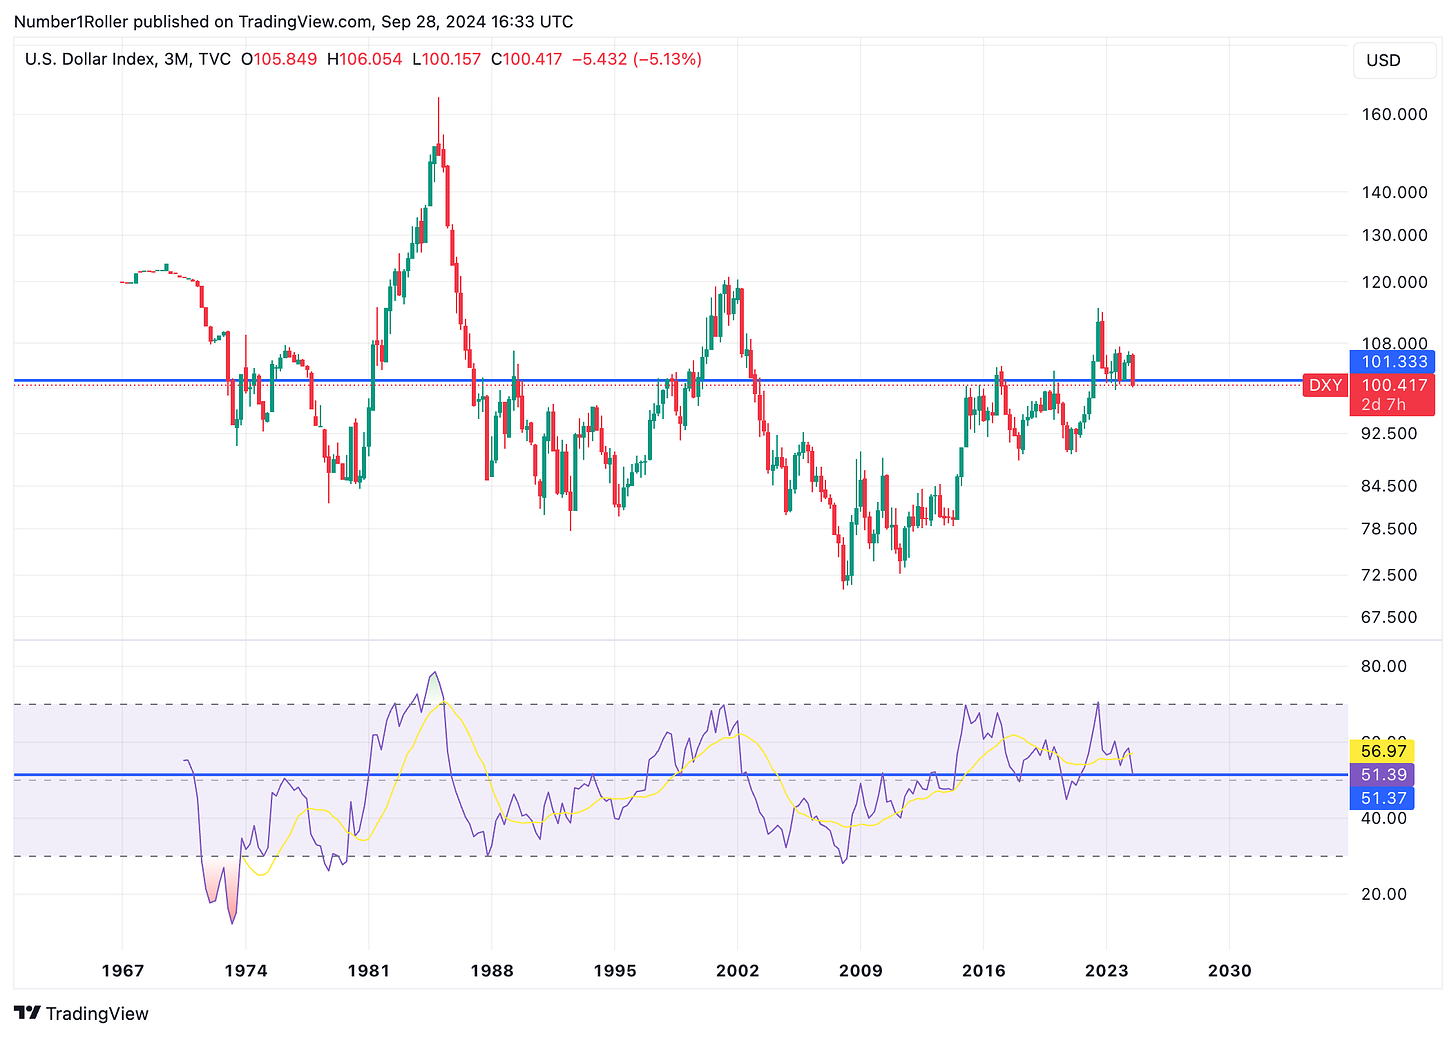
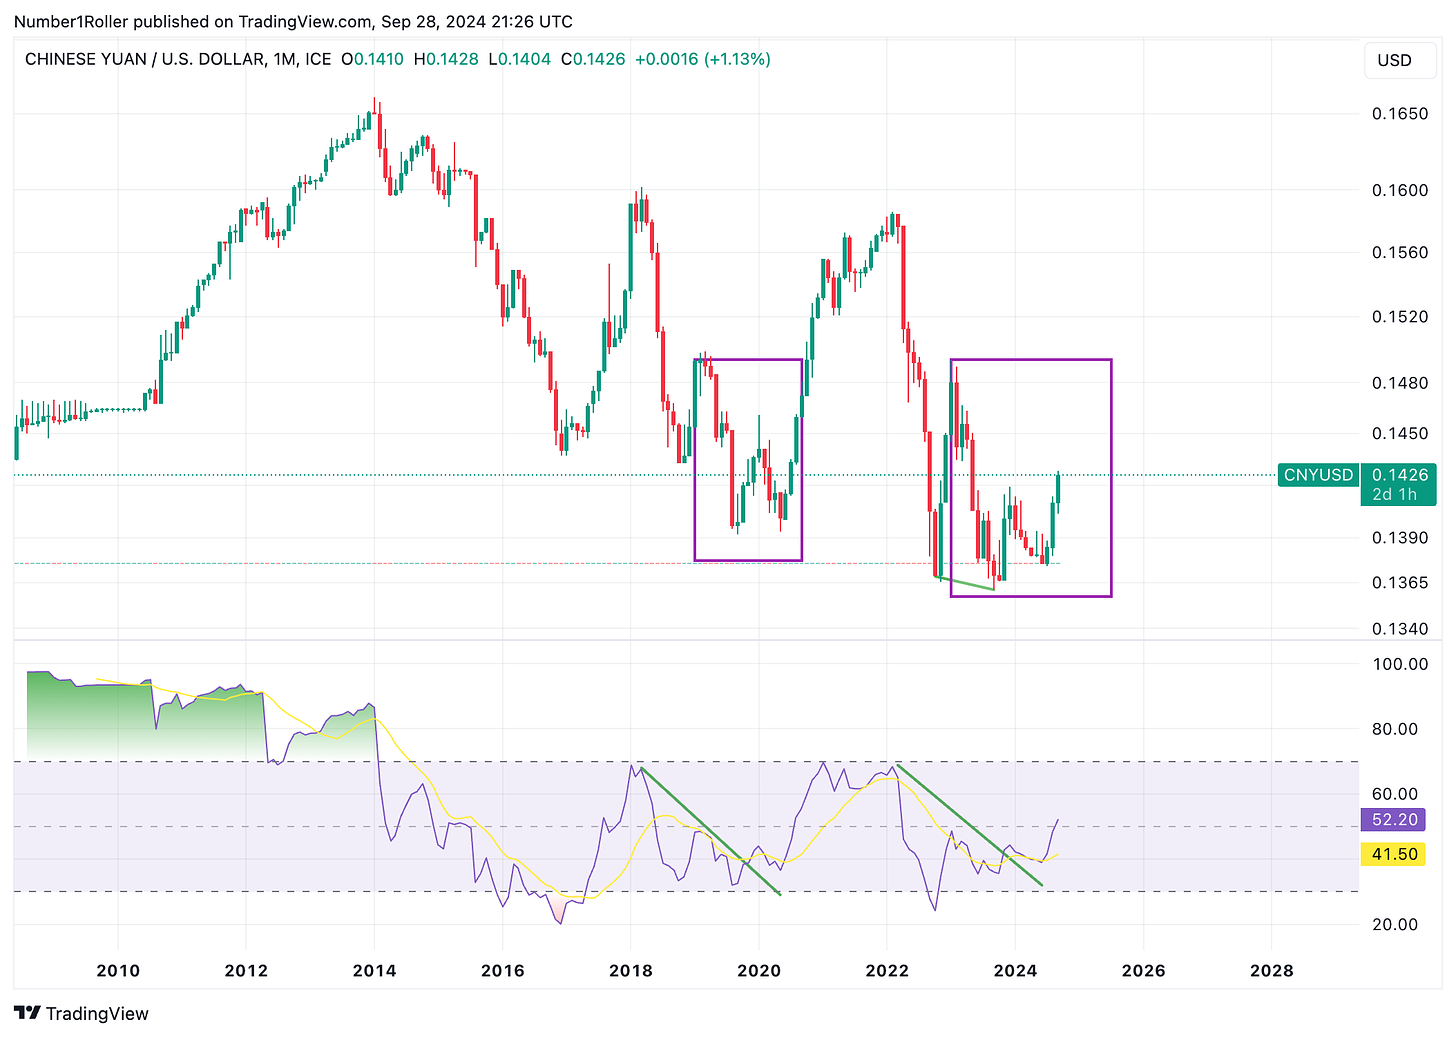
I am not a forex expert but I do know charts and DXY is worth sharing here with its comparison the the Yuan. Right now we are seeing a major level on this 3 month chart breaking down. With a lower close and major level being lost this shows a risk on environment is ready to get underway.
Looking at the Yuan/DXY we know Chinese equity market pumps have been closely correlated to major bull market runs. With the massive Chinese stimulus package hitting the economy and the global monetary easing policies going on, we are seeing nearly the same price action in the YUAN that preceded the 2020-21’ bull market on this monthly chart. Yet another signal that the dollar is getting weaker and the global liquidity is rising big time.
IWM
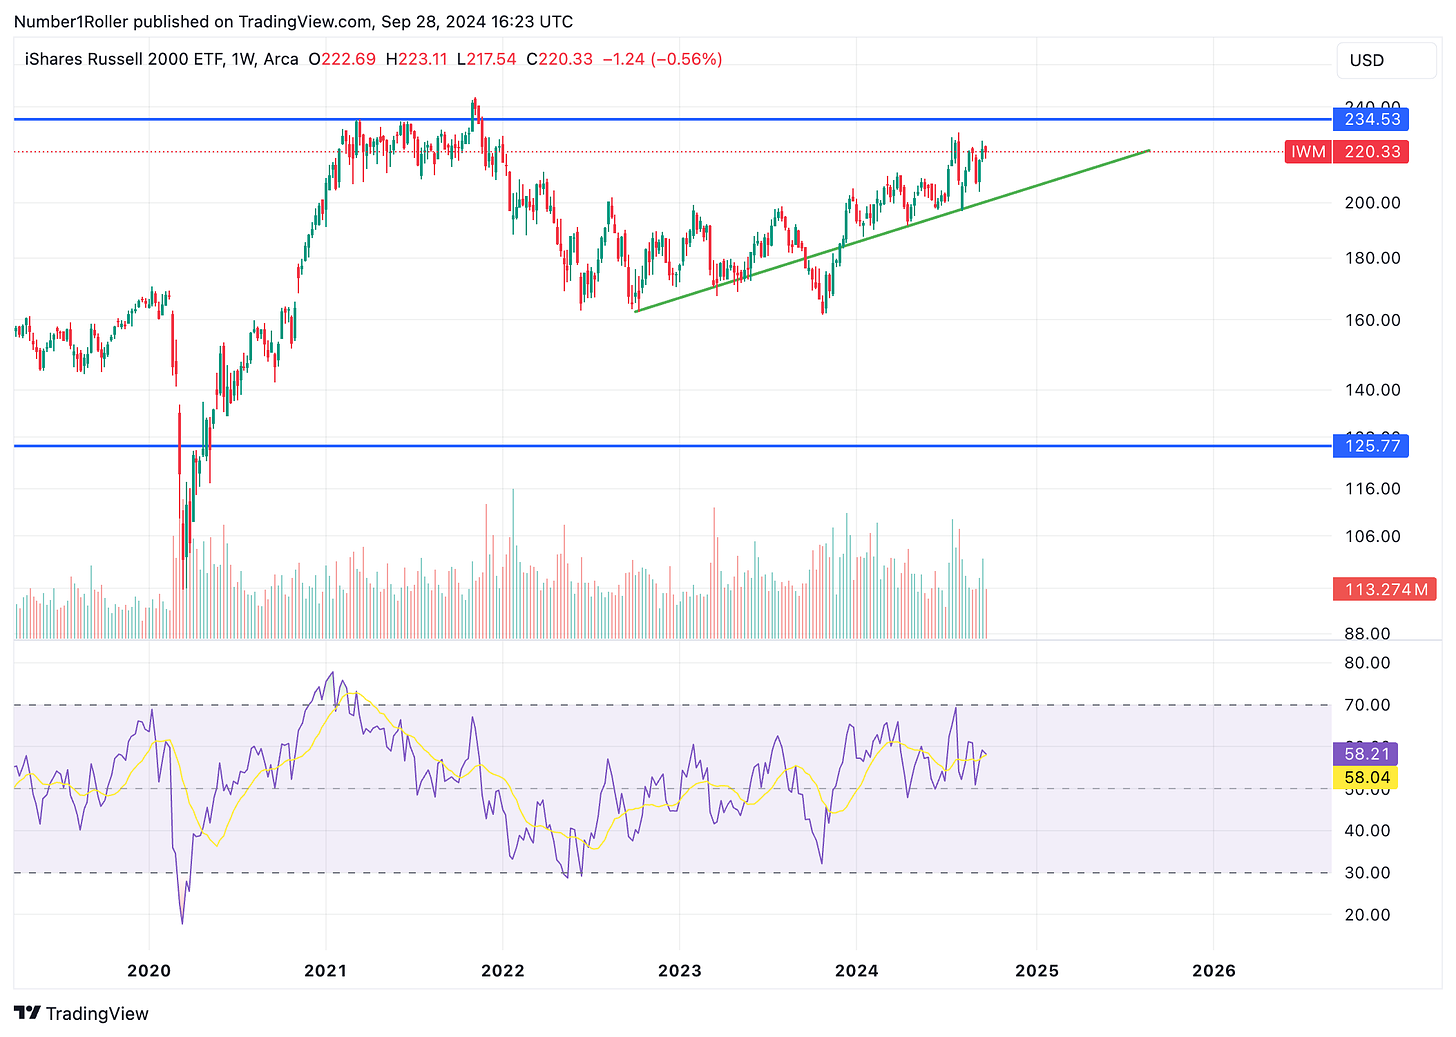
Lastly, the IWM small cap ETF is a great barometer for higher risk environments. As dealmaking on Wall Street heats up it creates a boon for small caps with mergers and acquisitions underway by investment banks. We can see here on this weekly chart that it looks similar to many of our crypto ALT charts that are forming this weekly and monthly ascending triangle pattern. A very powerful pattern and one, that if it breaks out, you’ll want to be along for the ride.
Conclusion
The convergence of multiple market indicators, from time reversals to global stimulus measures, is painting a clear picture of an emerging uptrend across risk on assets. All this is not to say rush out and bet the house on the market. Those of you that have been following us the past few weeks know that we have been warning about a potential pull back in the early part of October. This is a multi month view that is taking shape and will take time to play out.
Patience and conviction will remain paramount as we navigate this shifting sentiment, with risk-on environments and bullish patterns continuing to take hold. The key now is to stay focused, avoid overtrading, and ride the momentum as the market confirms what we have been anticipating for so long.
As we approach what will be the leg that propels this market into a mania, it’s more important than ever to be more intentional with our time and focus. The coming months will demand an even greater effort to tune out the noise and concentrate on delivering value. By becoming a premium subscriber, you’ll gain access to the best strategies, portfolios, and market insights tailored to your situation. Now is the time to position yourself for the wave ahead—let us help you get there.


