
The Make-or-Break Moment for Crypto Is Here
Today’s weekly outlook we’re going to zoom out on this cycle and see why we are once again at a huge inflection point.
I’m going to show you how time, price, and sentiment are all coming together for a major move in the coming days.
We have a lot to cover today.
We’re going to look at a lot of macro charts, mainly focusing on alts but we’re also going to compare that to stocks, the dollar, BTC dominance and even some memes.
All this will show you why this time suggests we are at such a big cycle inflection point for everything across the board.
This will be a critical outlook and one that is going to cement how to look at the market in the coming days as we approach a true make or break moment here.
Sentiment and Structure
The first thing I want to highlight today is a video we did back in April of 2024 warning of this exact moment in the market.
I even called it: How and When the Crypto Market Will Fool Everyone
This video I consider a must watch for readers because it tells you not only how market structures work, but in the video I prove that each and every crypto cycle has a major false alarm moment in a bull market just before the biggest moves to the upside occur.
That is exactly where I believe we are right now and I will show you why below.
The first thing that tells of how out of touch sentiment is is this graphic from Duality Research I saw on X.

AAII is a good sentiment survey that I used to cover often. I even covered it last week because of its notable pessimism while stocks are nearly at all time highs.
However, I did not notice that it was the highest bearish reading since November of 2023. That’s pretty shocking given how close to fresh highs this market is and not only that but if you remember what happened after Oct/November 2023, stocks soared to new records.
We even wrote a post during the height of the October panic — The Stage Is Set: Stocks Will Make New All Time Highs By February.
It was something no one saw coming but we did.
I see a similar setup in sentiment today but it’s not just the sentiment, people are betting heavily against this market.
See the ETH shorts chart below showing they are piling up in record numbers. This type of behaviors always reminds me of the old wall street adage “the mob can’t be right”
It’s just the way markets work. They do whatever will cause the most amount of pain for the most amount of people.

Finally, I want to highlight a short excerpt from the annual forecast we did on Bitcoin to remind everyone of why we are still right on track.
The picture below is how I summed up the first two months of the year in BTC price action. So far so good and we are still on track for that mid month low in February to hit.
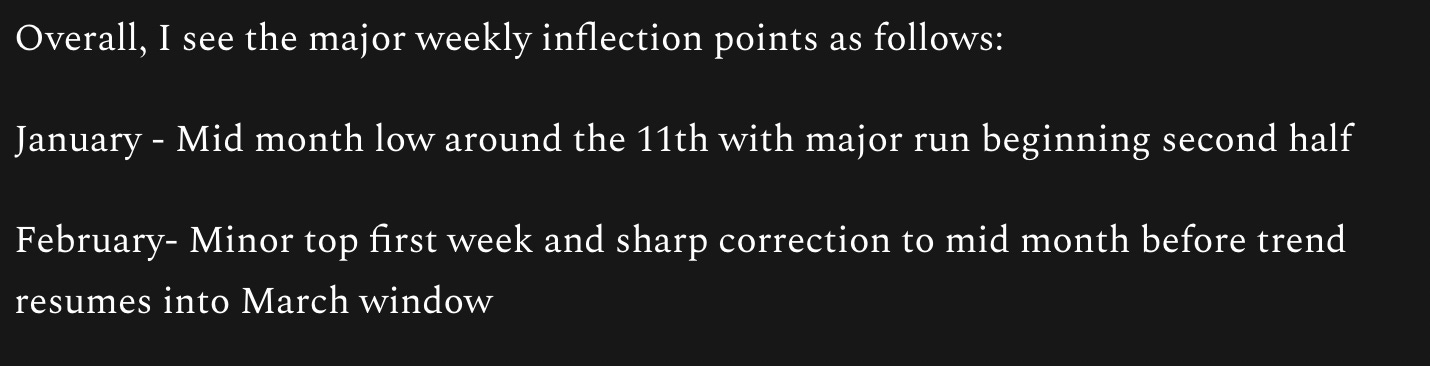
Granted I did not expect alts to get hit this hard and sentiment to be so brutal but time is proving again that we can see these developments with enough study of previous cycles.
I am offering this report separately if you want to get access to it as a non premium reader you can do so here today only at 30% off.
Now lets look into some charts and see why this month is proving to be a critical one and we should expect some interesting news developments in the coming days.
OTHERS/BTC
The first group of charts I want to look at is small caps versus Bitcoin.
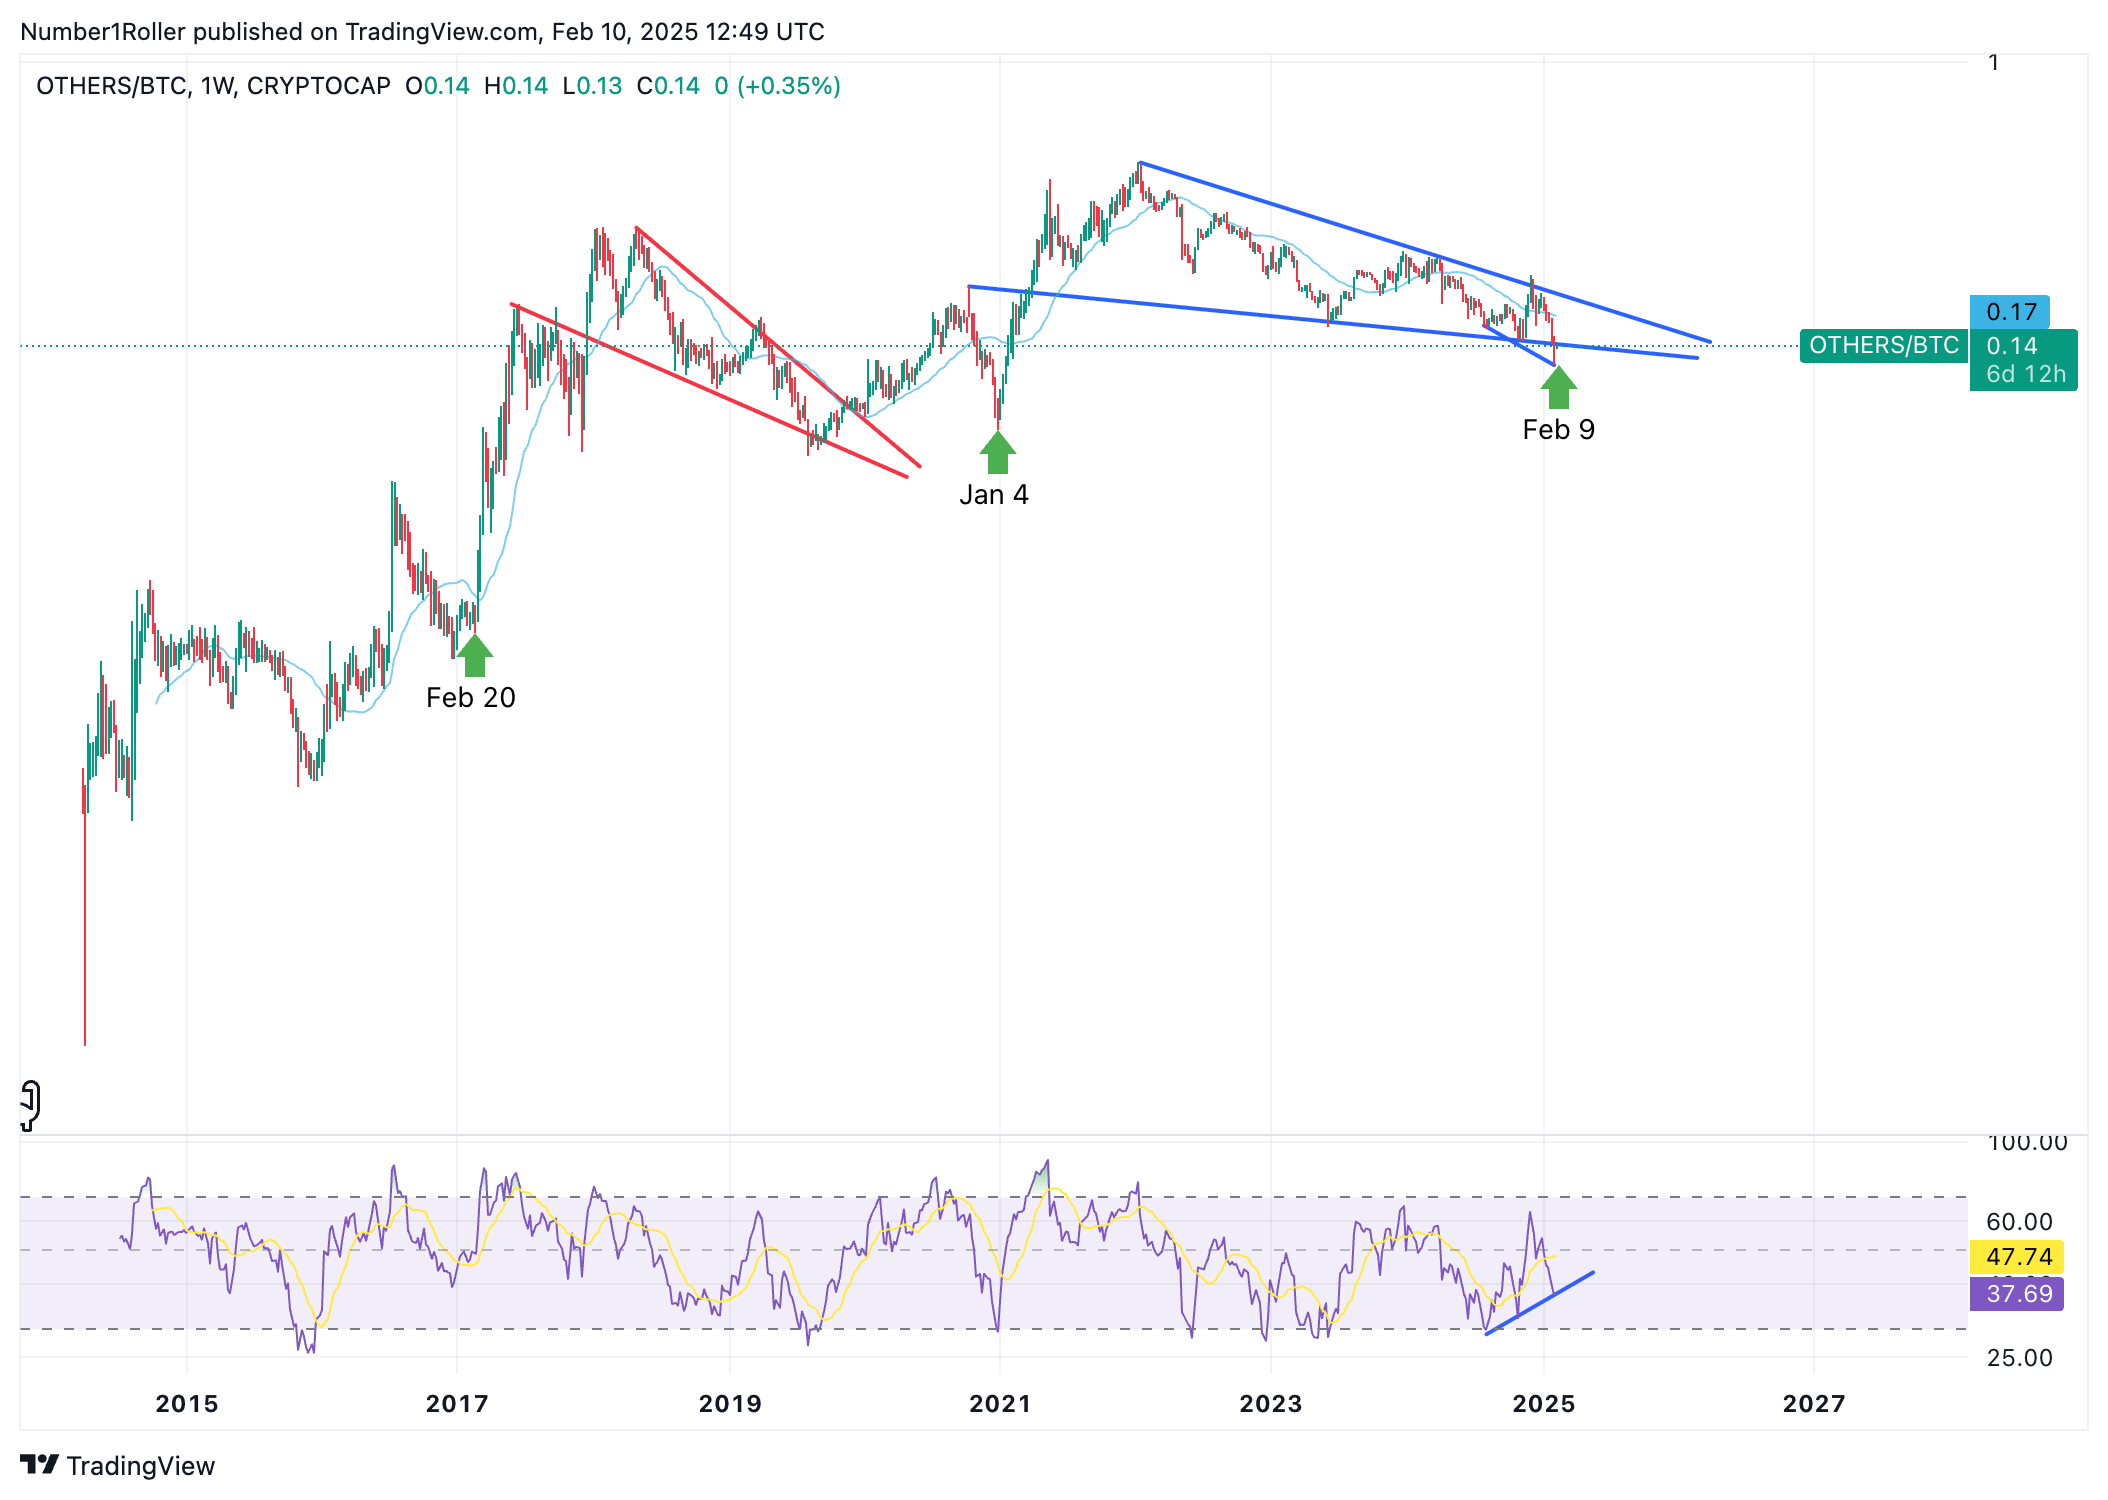
Here we have the log chart of OTHERS/BTC. This chart shows clearly a massive falling wedge with what looks to be a huge bullish deviation between price and RSI on this weekly view.
Notice when the 2017 cycle started. The major move came as late as February 20th and the 2021 cycle started after January 4th.
Our current cycle still mirrors closer to 2017 and many of the following charts build even more evidence for that. So remember that major move did not happen until late February.
Another look here at the same chart but this time on the regular scale.
This clearly shows the chart at a major high time frame support level that it has bounced off of since that 2017 cycle. Usually selling at a major support level is not the best idea yet the market decided to get as bearish as possible here..
Now looking at the OTHERS crypto market cap chart alone, you can see that it too is siting right on a very long standing support level. Each time the market has hit this level it has rallied hard.

I also want to highlight the 20 month ranges we saw from the inception of this chart to that major low before all hell broke look into 2017.
Seeing as that we are today 20 months from the inception of this current cycle it makes for an interesting time frame to watch especially when you consider the key level price is at.
TOTAL
The next TOTAL chart is very interesting and very similar to the 2017 run on this setup.

Look again at the time ranges from the inception of the cycle to the 2017 melt up. We see nearly the identical range and price action here again.
Breakout consolidate just above the ATH around 28 months into the cycle then takeoff. Note the similarities in the monthly RSI as well. Not only is it similar to 2017 but it never got anywhere near the overheated levels as the last two cycles.
I’d say this suggests we are very close.
BTC.D and DXY
Remember the very first chart above of OTHER/BTC. This BTC dominance chart is shaping up in the exact opposite way as its basically just the inverse of that chart.

Notice the new weekly high being met right below the .75% level at the same time a huge bearish divergence is shaping up on the RSI. The exact inverse of OTHERs/BTC
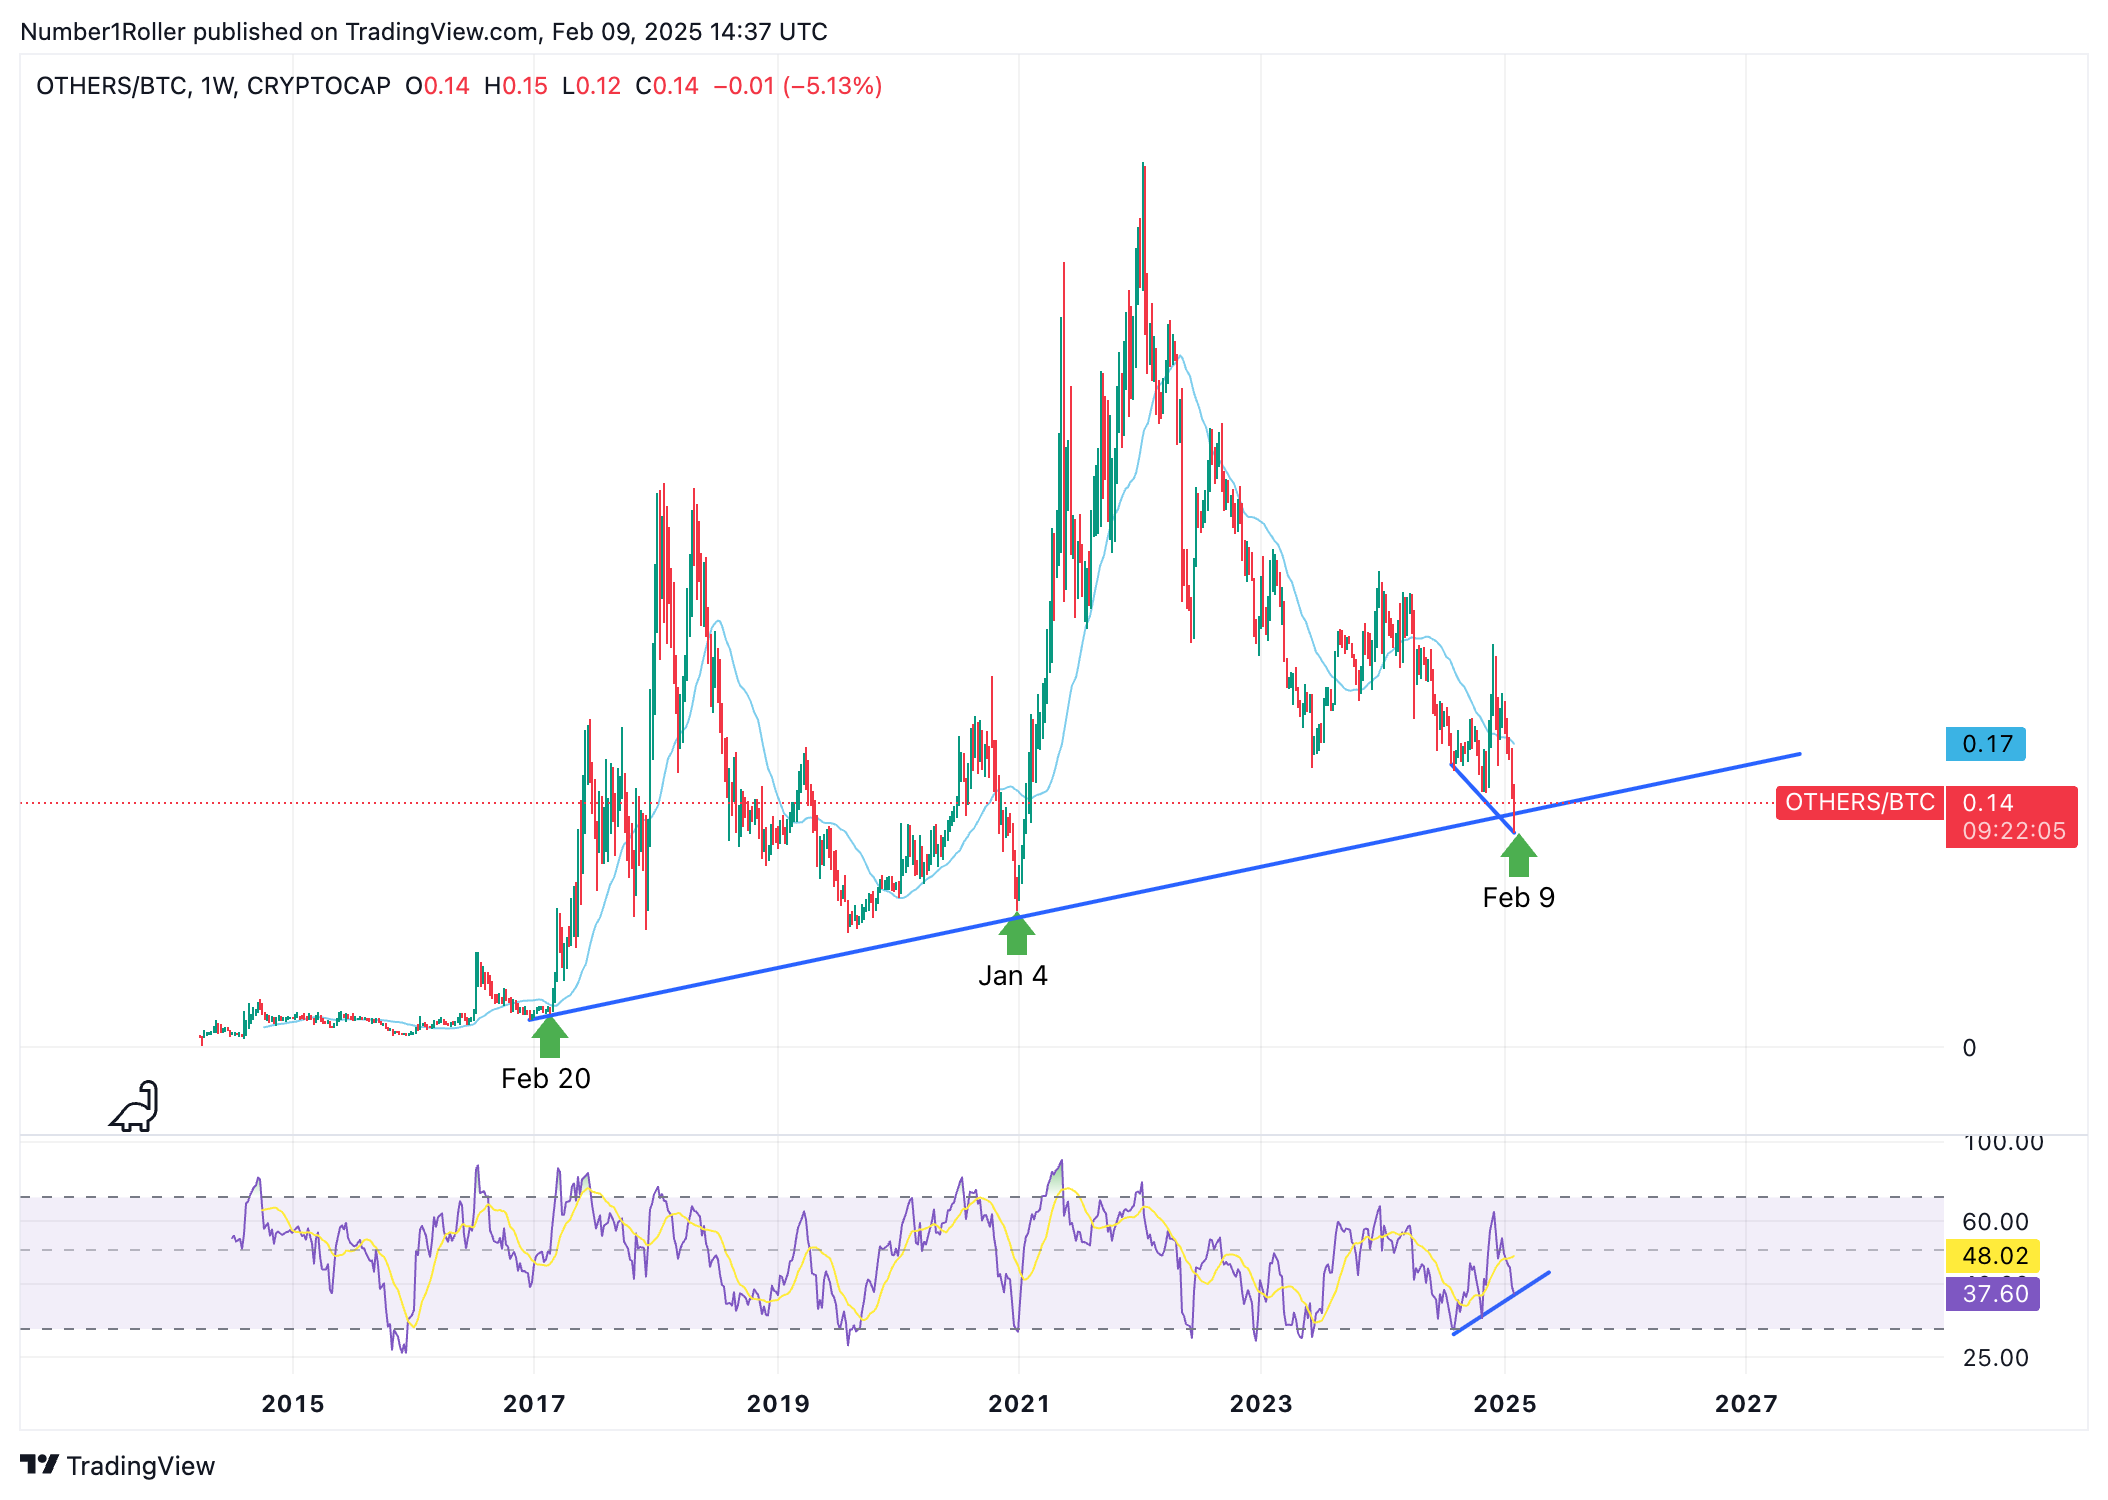
I also wanted to compare that to the setup we see on the dollar as a drop in the strength of DXY is usually what we should expect late cycle and also serves as a tailwind for a risk on environment.
There are not many divergences I see here that are particularly noticeable however this chart shares close similarities with the 2017 chart of the DXY.
The key indicators I see here are the 120 weeks from the 2022 high and then a signal reversal candle and bearish overbalance in time.
Finally, it had a weekly bounce to a lower high. So keep a close eye on the dollar as the month closes out and it gets major resistance at key high time frames.
IWM
I want to briefly cover small cap stocks index because it is usually a good indication of where risk taking is at in the stock market and I believe if we have yet to see real risk taking in stocks we have yet to see it in crypto.

Because the IWM has yet to break out to fresh records from its 2021 top, it tells us that as strong as the stock market has been, people still aren’t taking risks in the low cap stock space as you normally would see in a real mania stage.
This is a key sign of the cycle when the IWM gets going and the fact that it hasn’t yet, means that we still have a long way to go before we see things that are truly crazy and bubble behavior like.
ETH
I know I’m jumping around a bit here but lets get back to ETH. As I said to premium readers I think the chance of some news coming out for ETH here in the next 10 days is quite high as it will be 30 weeks from the ETF launch.
If we look at some interesting time factors of the ETH cycle below,
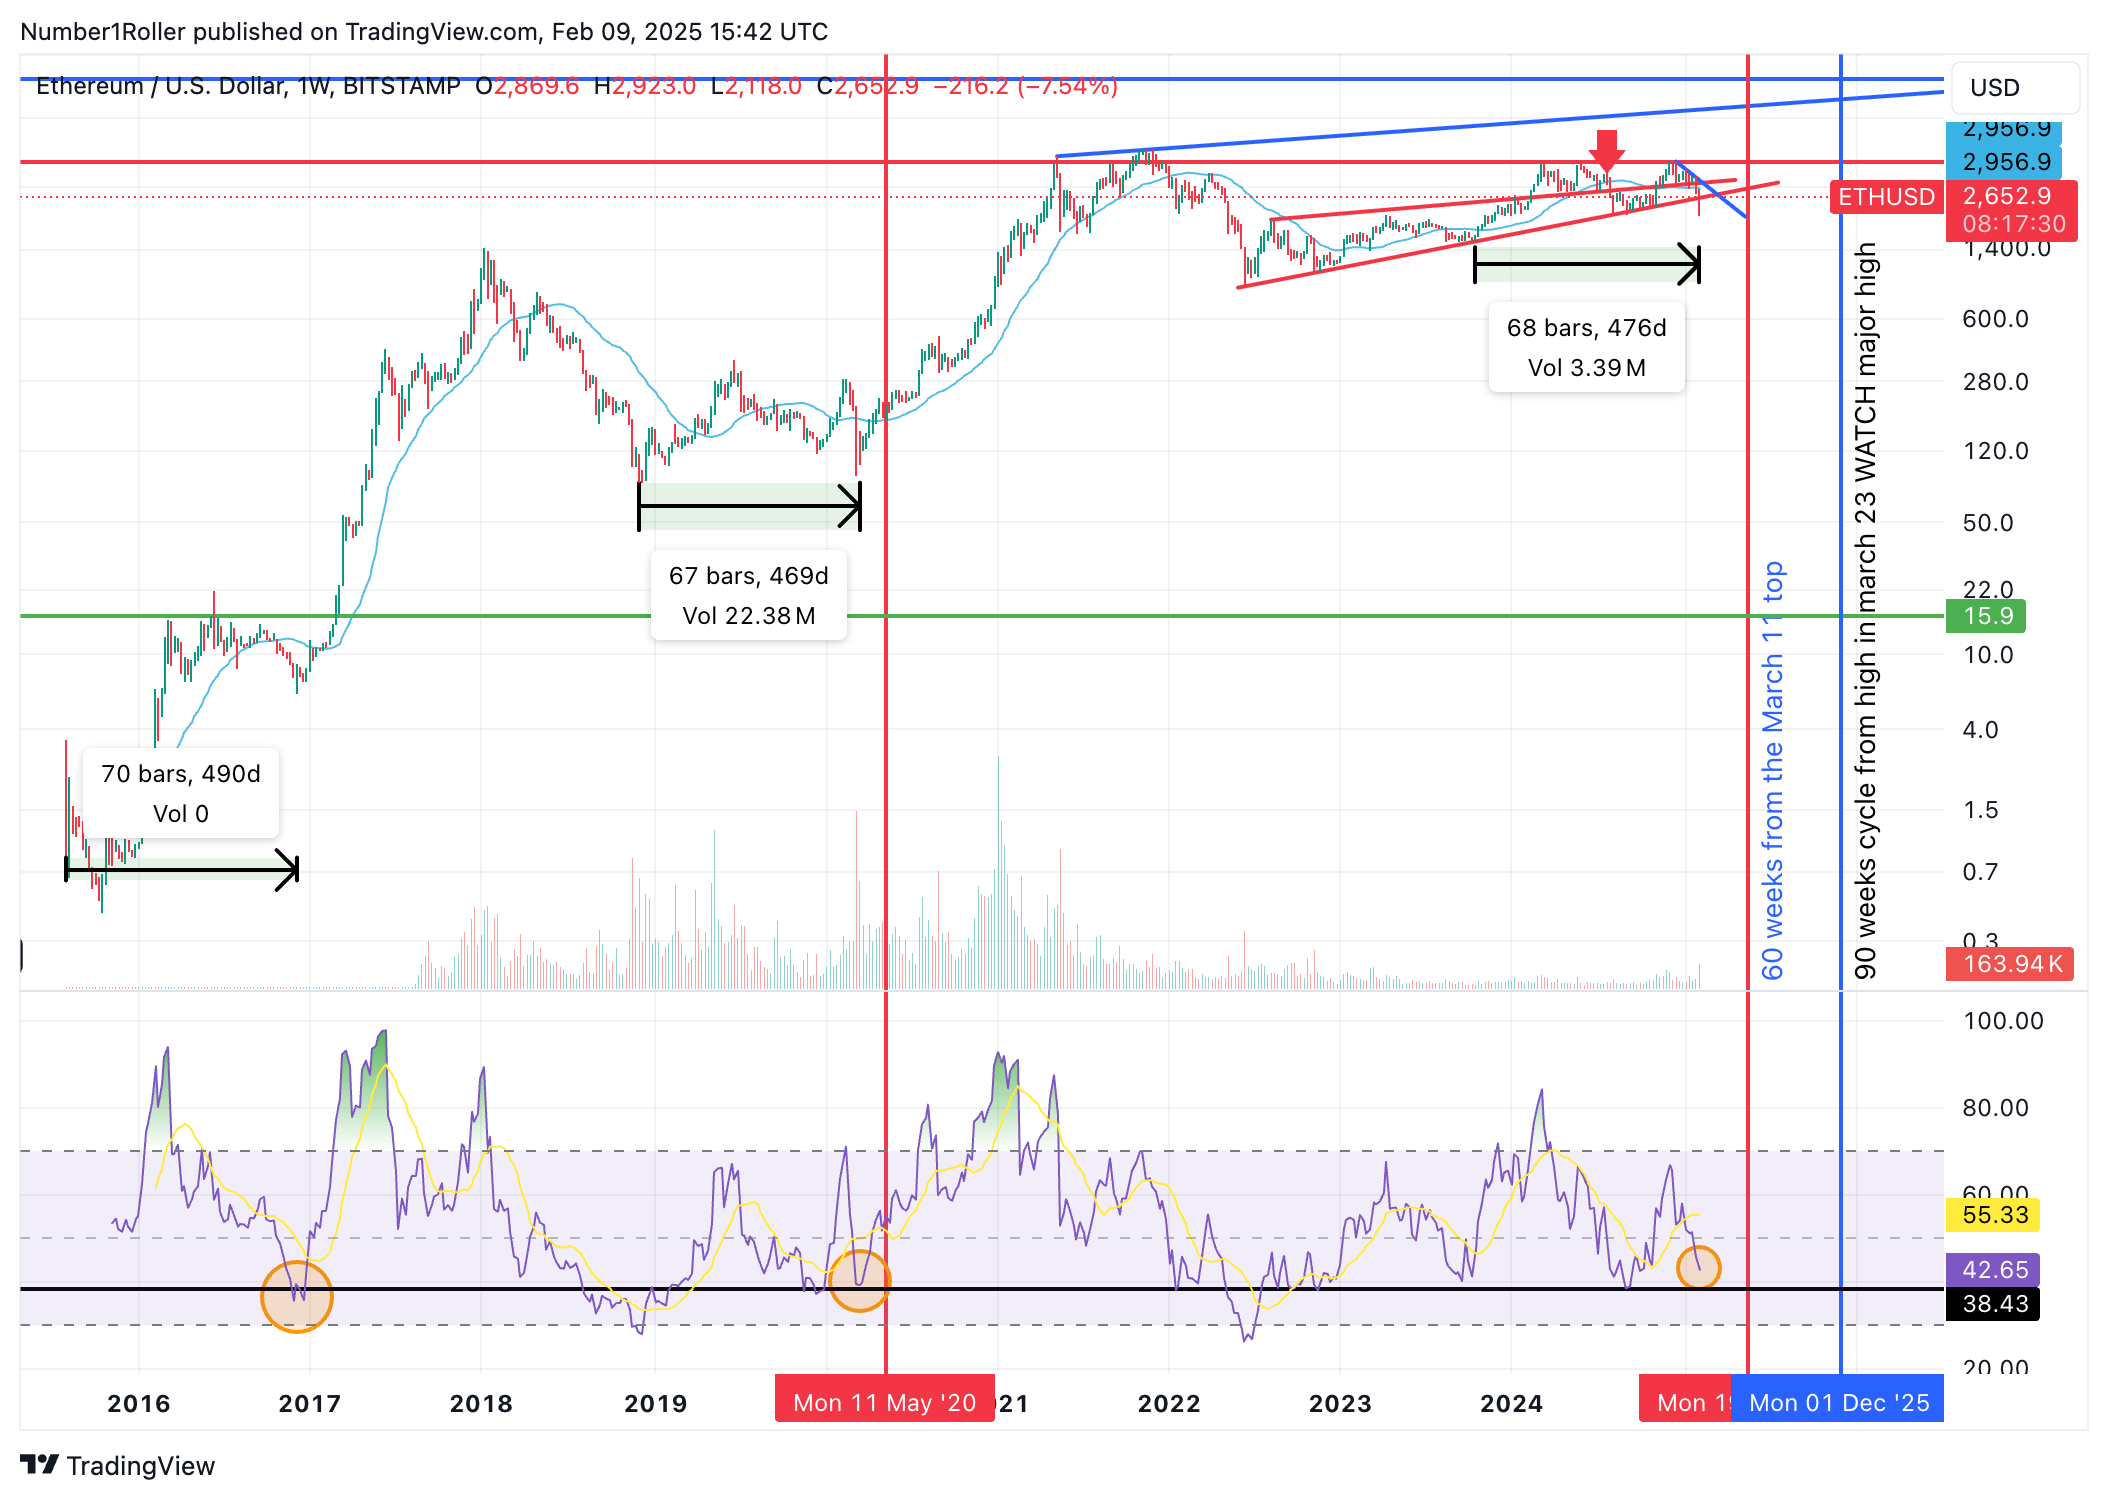
We can see that ETH loves this 68-70 week range as I have demonstrated in the last few weeks in other reports.
Not only have we seen it twice now in this current cycle but going back to previous cycles we can see that the massive move up in ETH came on both occasions after a huge flush and the 70 week window being met.
Lastly, not the level on the RSI that is being met is similar to those other two occasions.
ETH is also just closing its weekly above a key cycle support level as you can see below.

So again we have record short in ETH piling up 30 weeks from the ETF in another key 70 week window, all while it sits right on a major support level. I’m not sure who is shorting all that but I wouldn’t want to be in there.
ETH/BTC and DOGE/BTC
Again with regards to BTC dominance and total market caps we need to see a move up in ETH for this market to really get going.
I do not have much to say about this monthly ETH/BTC chart other than its at key areas of interest again while the sentiment is brutal and the shorts are chomping at the bit.

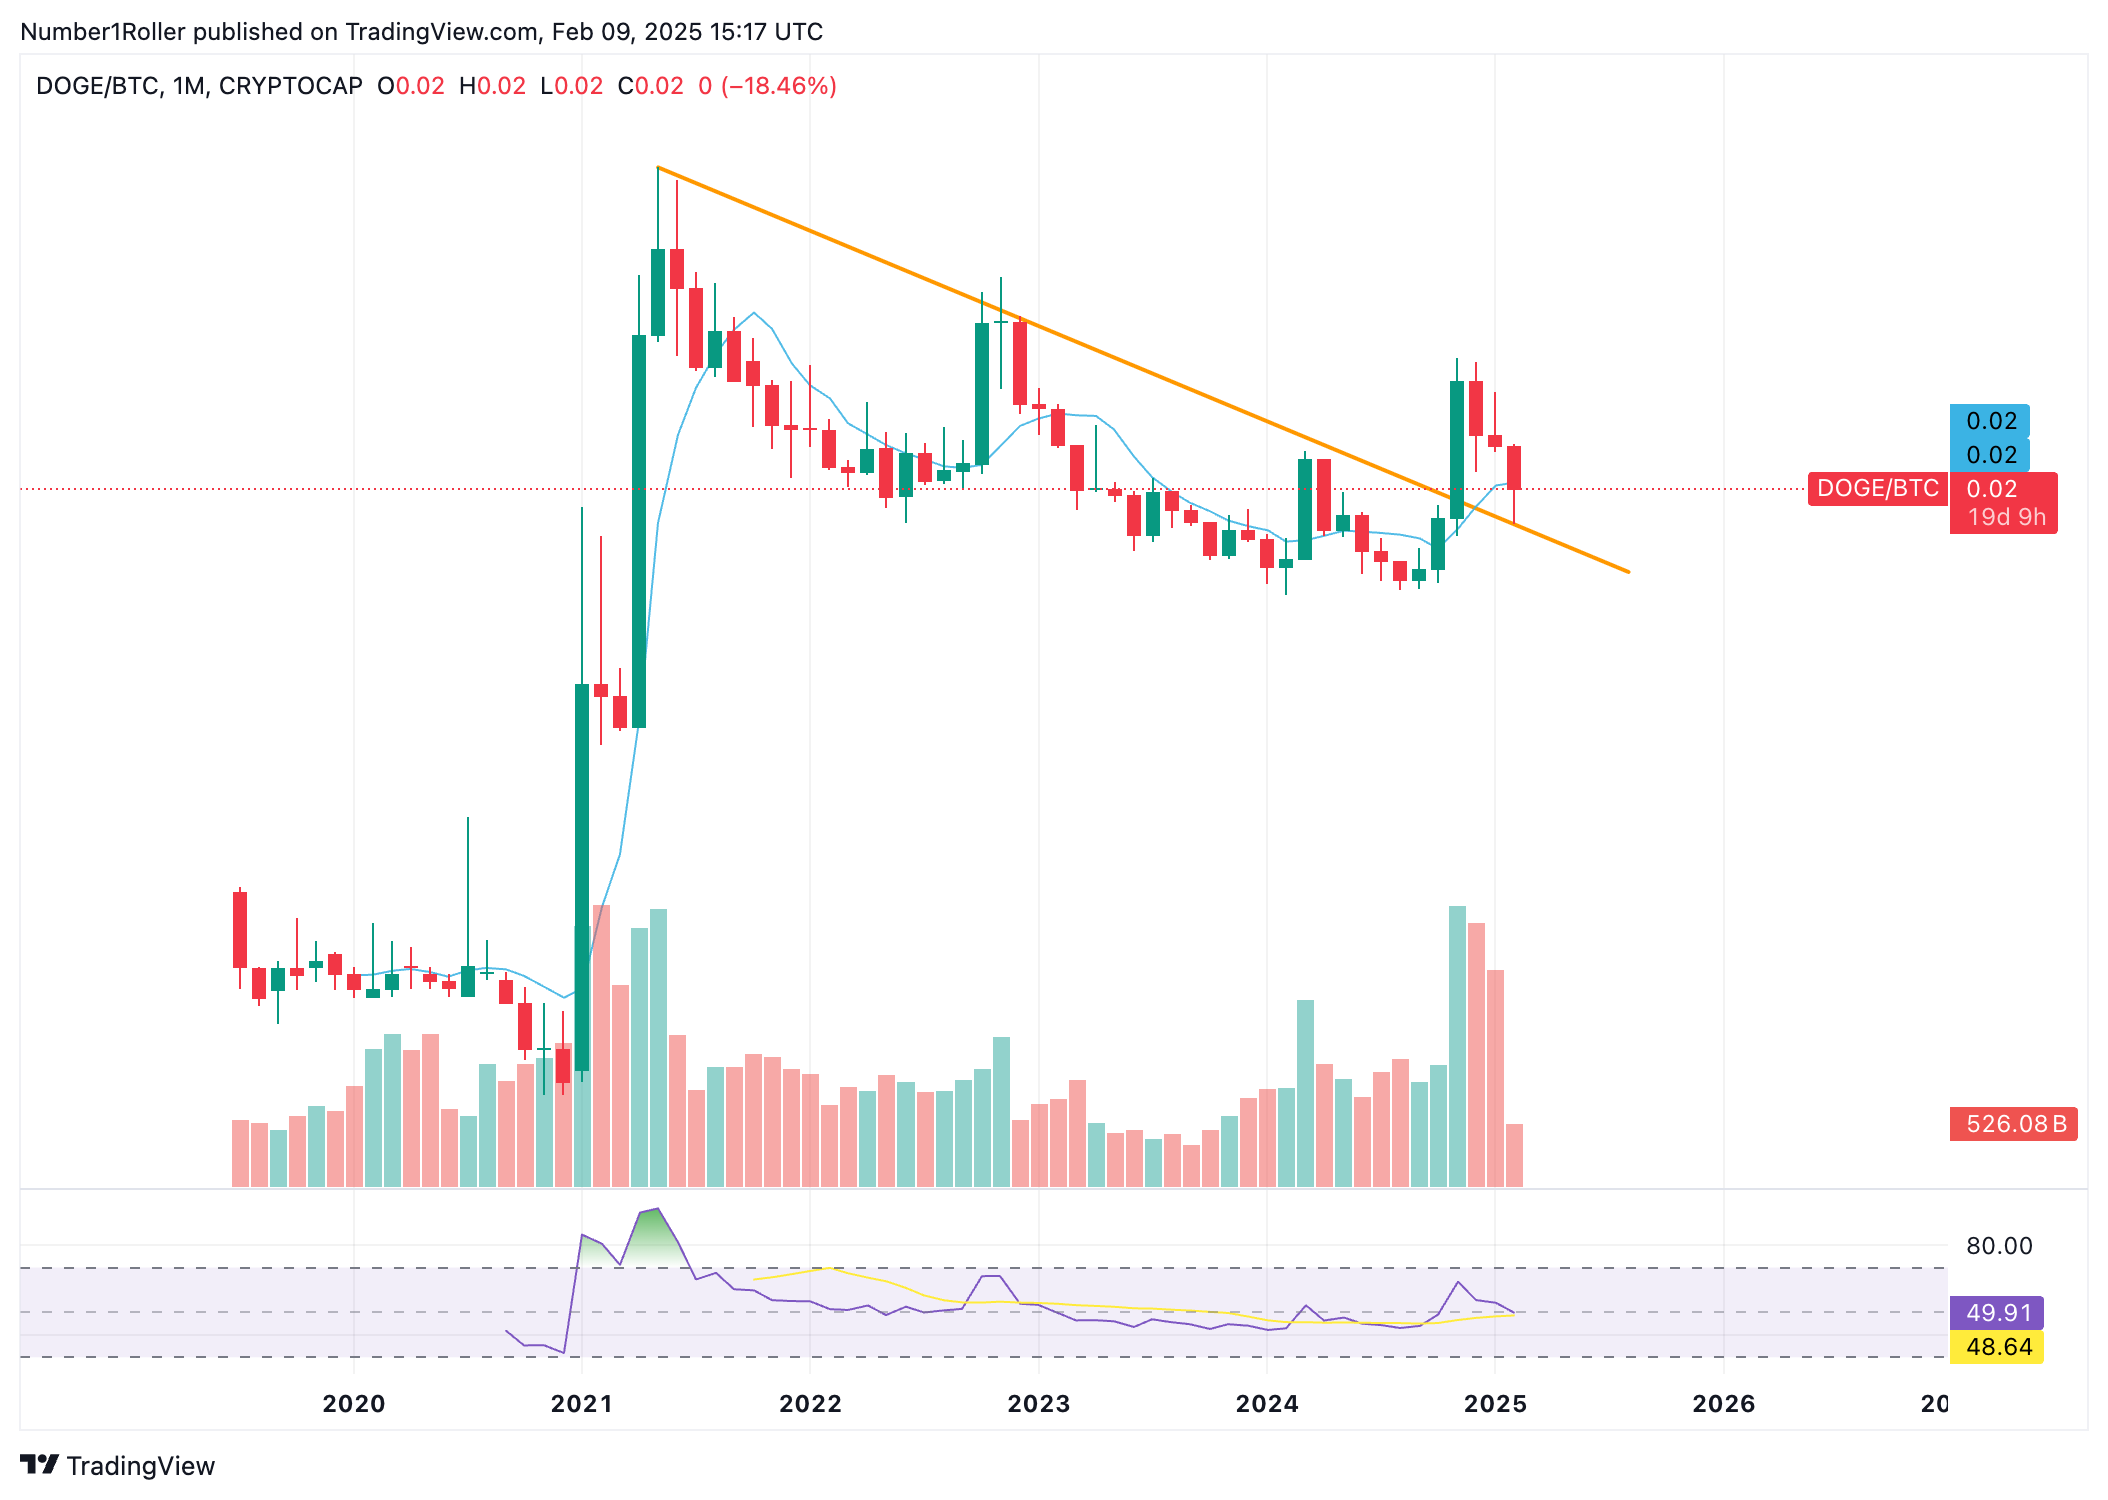
Same thing when we analyze this DOGE/BTC monthly chart. DOGE I guess you could say is somewhat of a risk on barometer for the the crypto market and it too has broken out here against BTC and is backtesting a huge level on this monthly chart.
MEMES
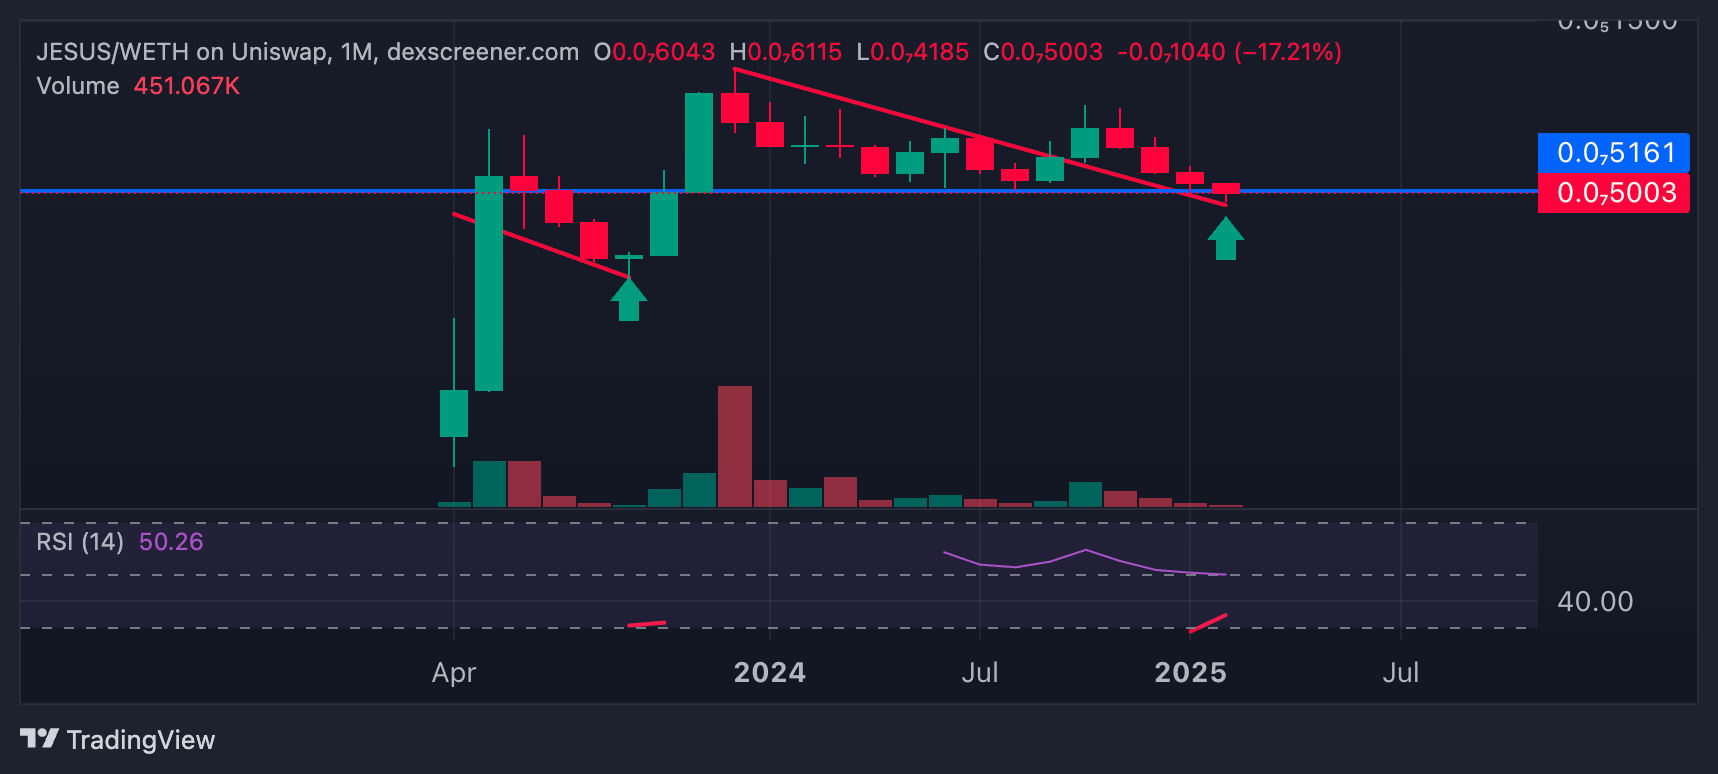
Finally, I’m going to cover some of our memes that we have held for this cycle to show you how they are also aligning with major levels and make or break moments in time.
I’m not going to dissect each one of these charts I’m just going to let you look at them and see how they are all sitting right on key monthly support levels.


Conclusion
The conclusion I draw from all of these charts is that we are at a make or break week/month for the crypto market.
I am optimistic in the sense that this is something we warned about many months ago and this is likely the last place you want to be selling after a 90% haircut.
Given the horrible sentiment in both the stock and crypto market coupled with the major monthly supports we are seeing in nearly all cryptos from ETH to memes to the TOTAL market cap I would highly favor a strong bounce as the worst case scenario.
However that may play out, we will have to see but given the risk signals I highlighted with regards to the broader cycle and record shorts in the market I still have to believe that we have yet to complete anywhere near a full cycle, particularly in regards to a mania stage.
It simply hasn’t happened yet and unless price is to fall out of bed here and break these macro supports away then I cannot see a scenario where the second half of this month doesn’t provide significant relief.
This is a reminder of how tough this market can be and how quickly things can turn for both better and worse. I have been in this long enough to tell you this is truly what it takes to make it in this environment.
Everyone thinks crypto is fun and games until they are in a serious hole because of the extreme volatility. I always warn people that this is a very brutal market that will take your money and leave you gasping.
I myself have grown callouses to it in my mind but I am sure this is gut wrenching for many people. You are not alone and it is by no means a cakewalk.
However, I am telling you through many cycles of experience that this volatility is why we are here.
As bad as it gets the upside can be 10x better when its there. The people that see the broader cycle for what it is and ignore the short term violence are the ones that survive to make the big money.