


Time, Cycles, and the Next Key Date
This week’s outlook sets the stage for something much bigger. I’m starting to unpack a broader thesis about where we are in this cycle—and more importantly, where we’re going. I’m diving into the bigger picture topics in preparation for a special report on why I believe this bull will run into 2027.
We’re in the middle of one large correction inside an even larger bull cycle. The four-year cycle isn’t wrong—it’s real, it’s been working—but crypto is evolving. With more time and maturity, the market is starting to reflect longer, more complex cycles. That shift is already underway, and I believe it’s what the charts are telling us right now.
Today I’ll start with the short-term picture—what to expect in the coming weeks and months—then walk you through a critical upcoming signal date. From there, we’ll zoom out to the bigger picture and explore why it's time to start thinking beyond the four-year framework.
First, I want to start with my chart I’m looking at on the daily time frame.
Everything from last week’s outlook still stands. We have yet to receive any full confirmation from the market that the bottom will not be revisited.
That said, I doubt it will be taken, due to the cycles I am going to show you in this report. However, if there is one date to watch for what could be another flush it will be the date I’m going to go into today.
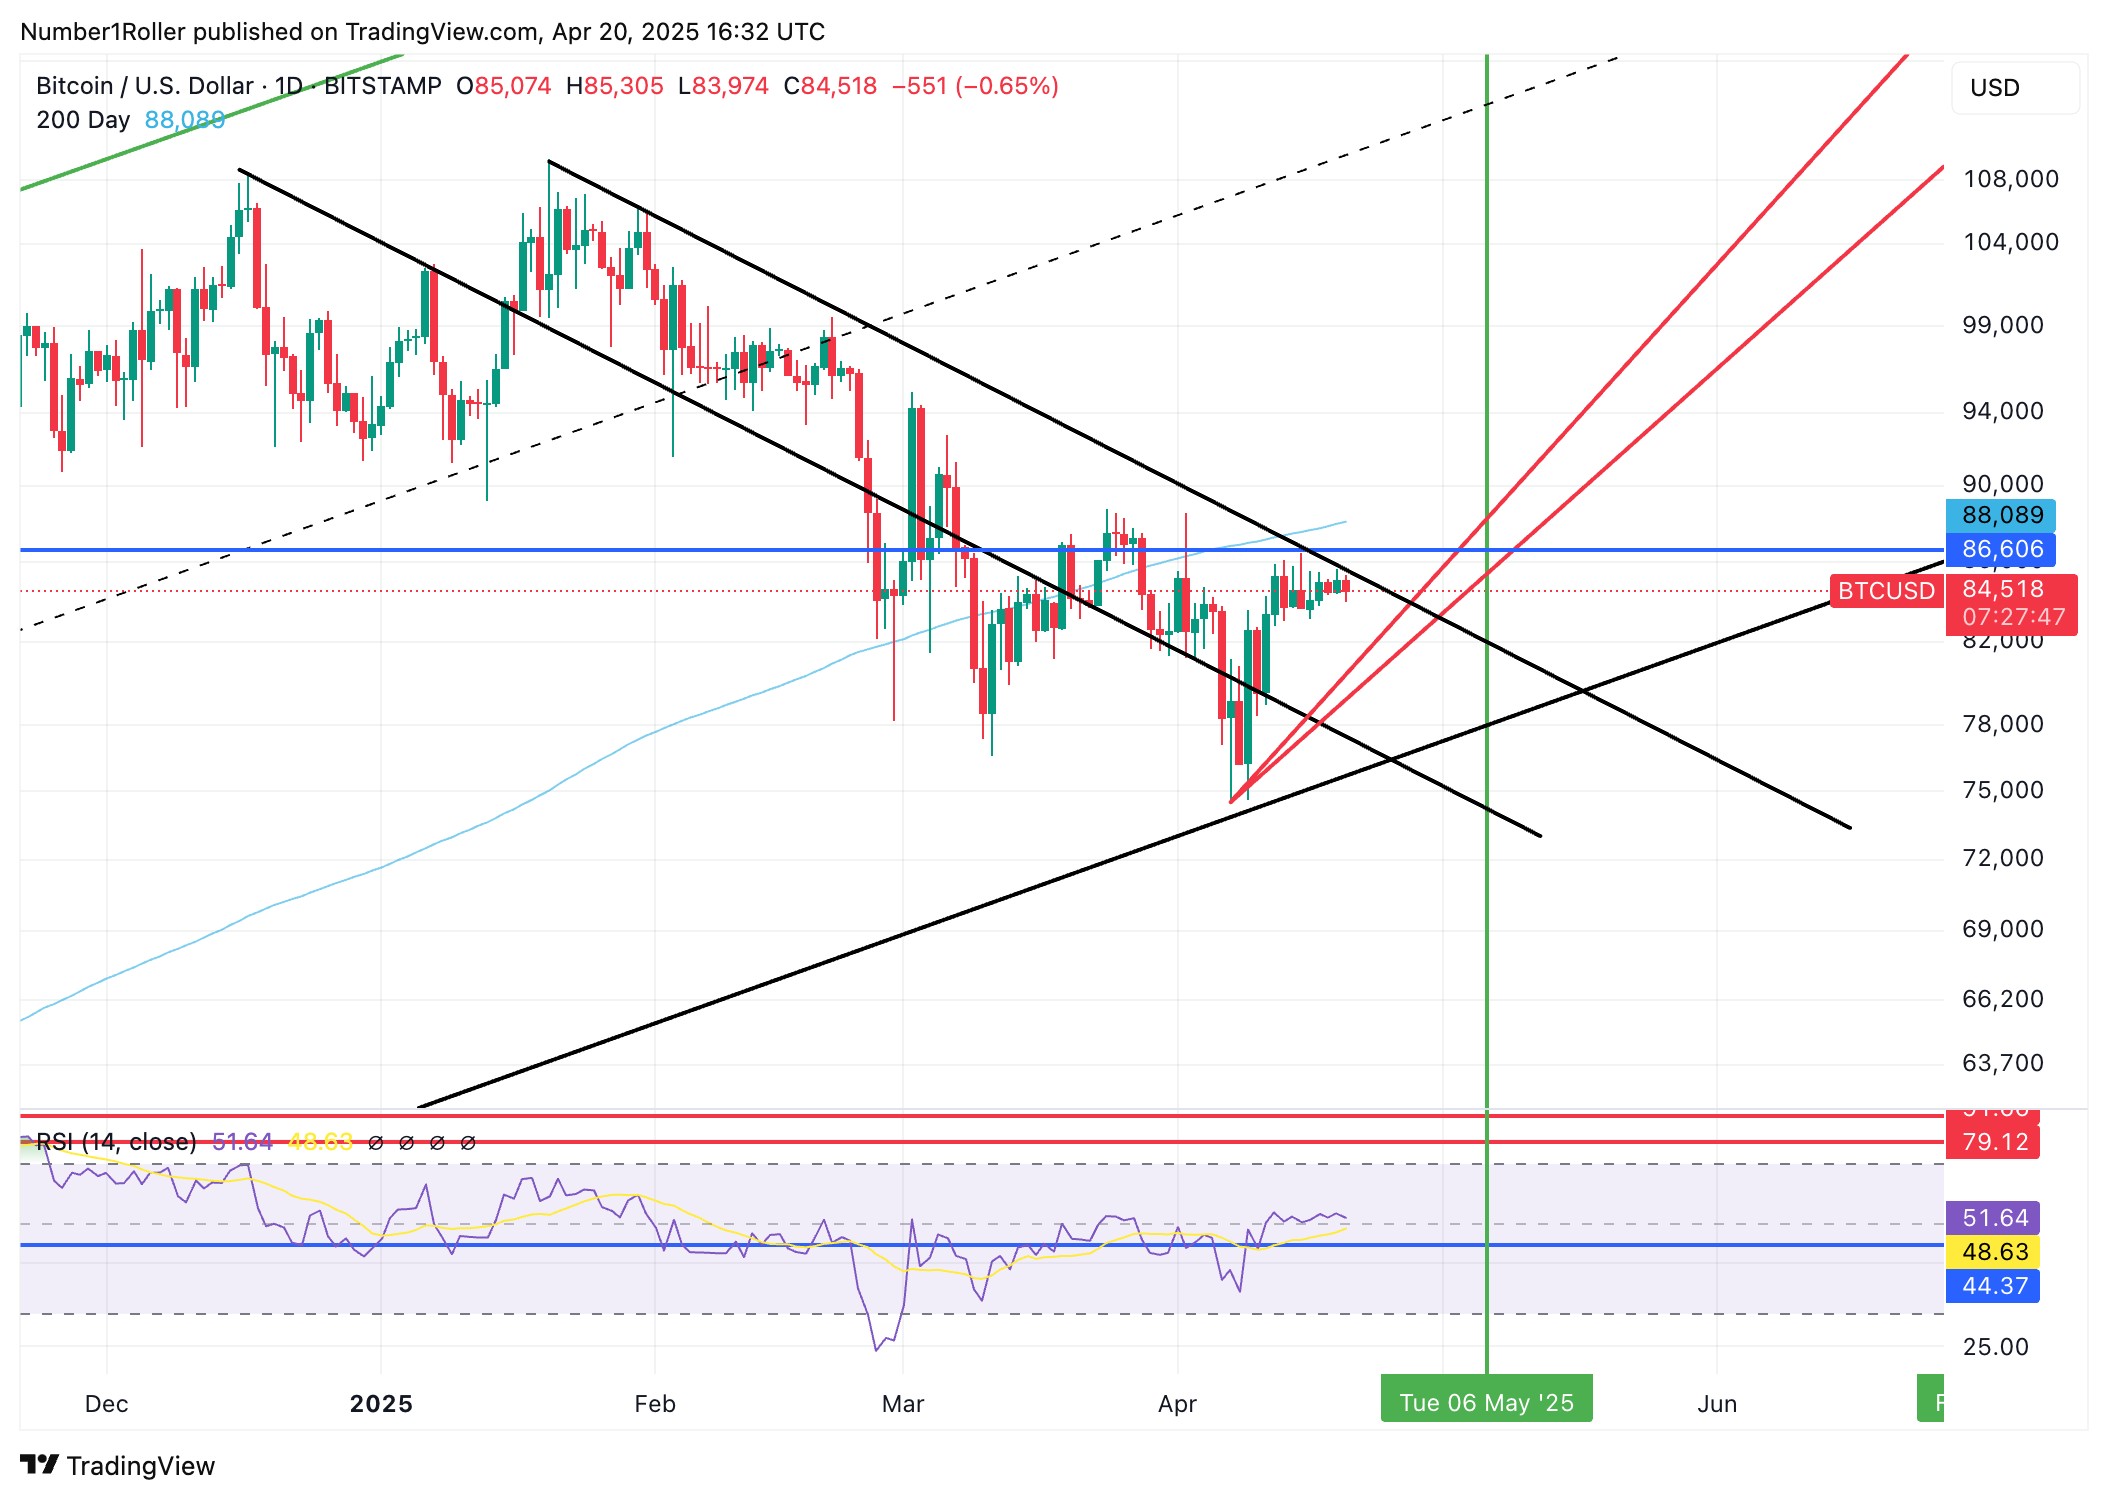
This is a simple chart I’m watching that shows two important angles in black along with a key level in blue. As you can see they are acting as clear resistance on this market and there is still no definitive signal one way or the other if you are watching the daily.
BTC Monthly Trend
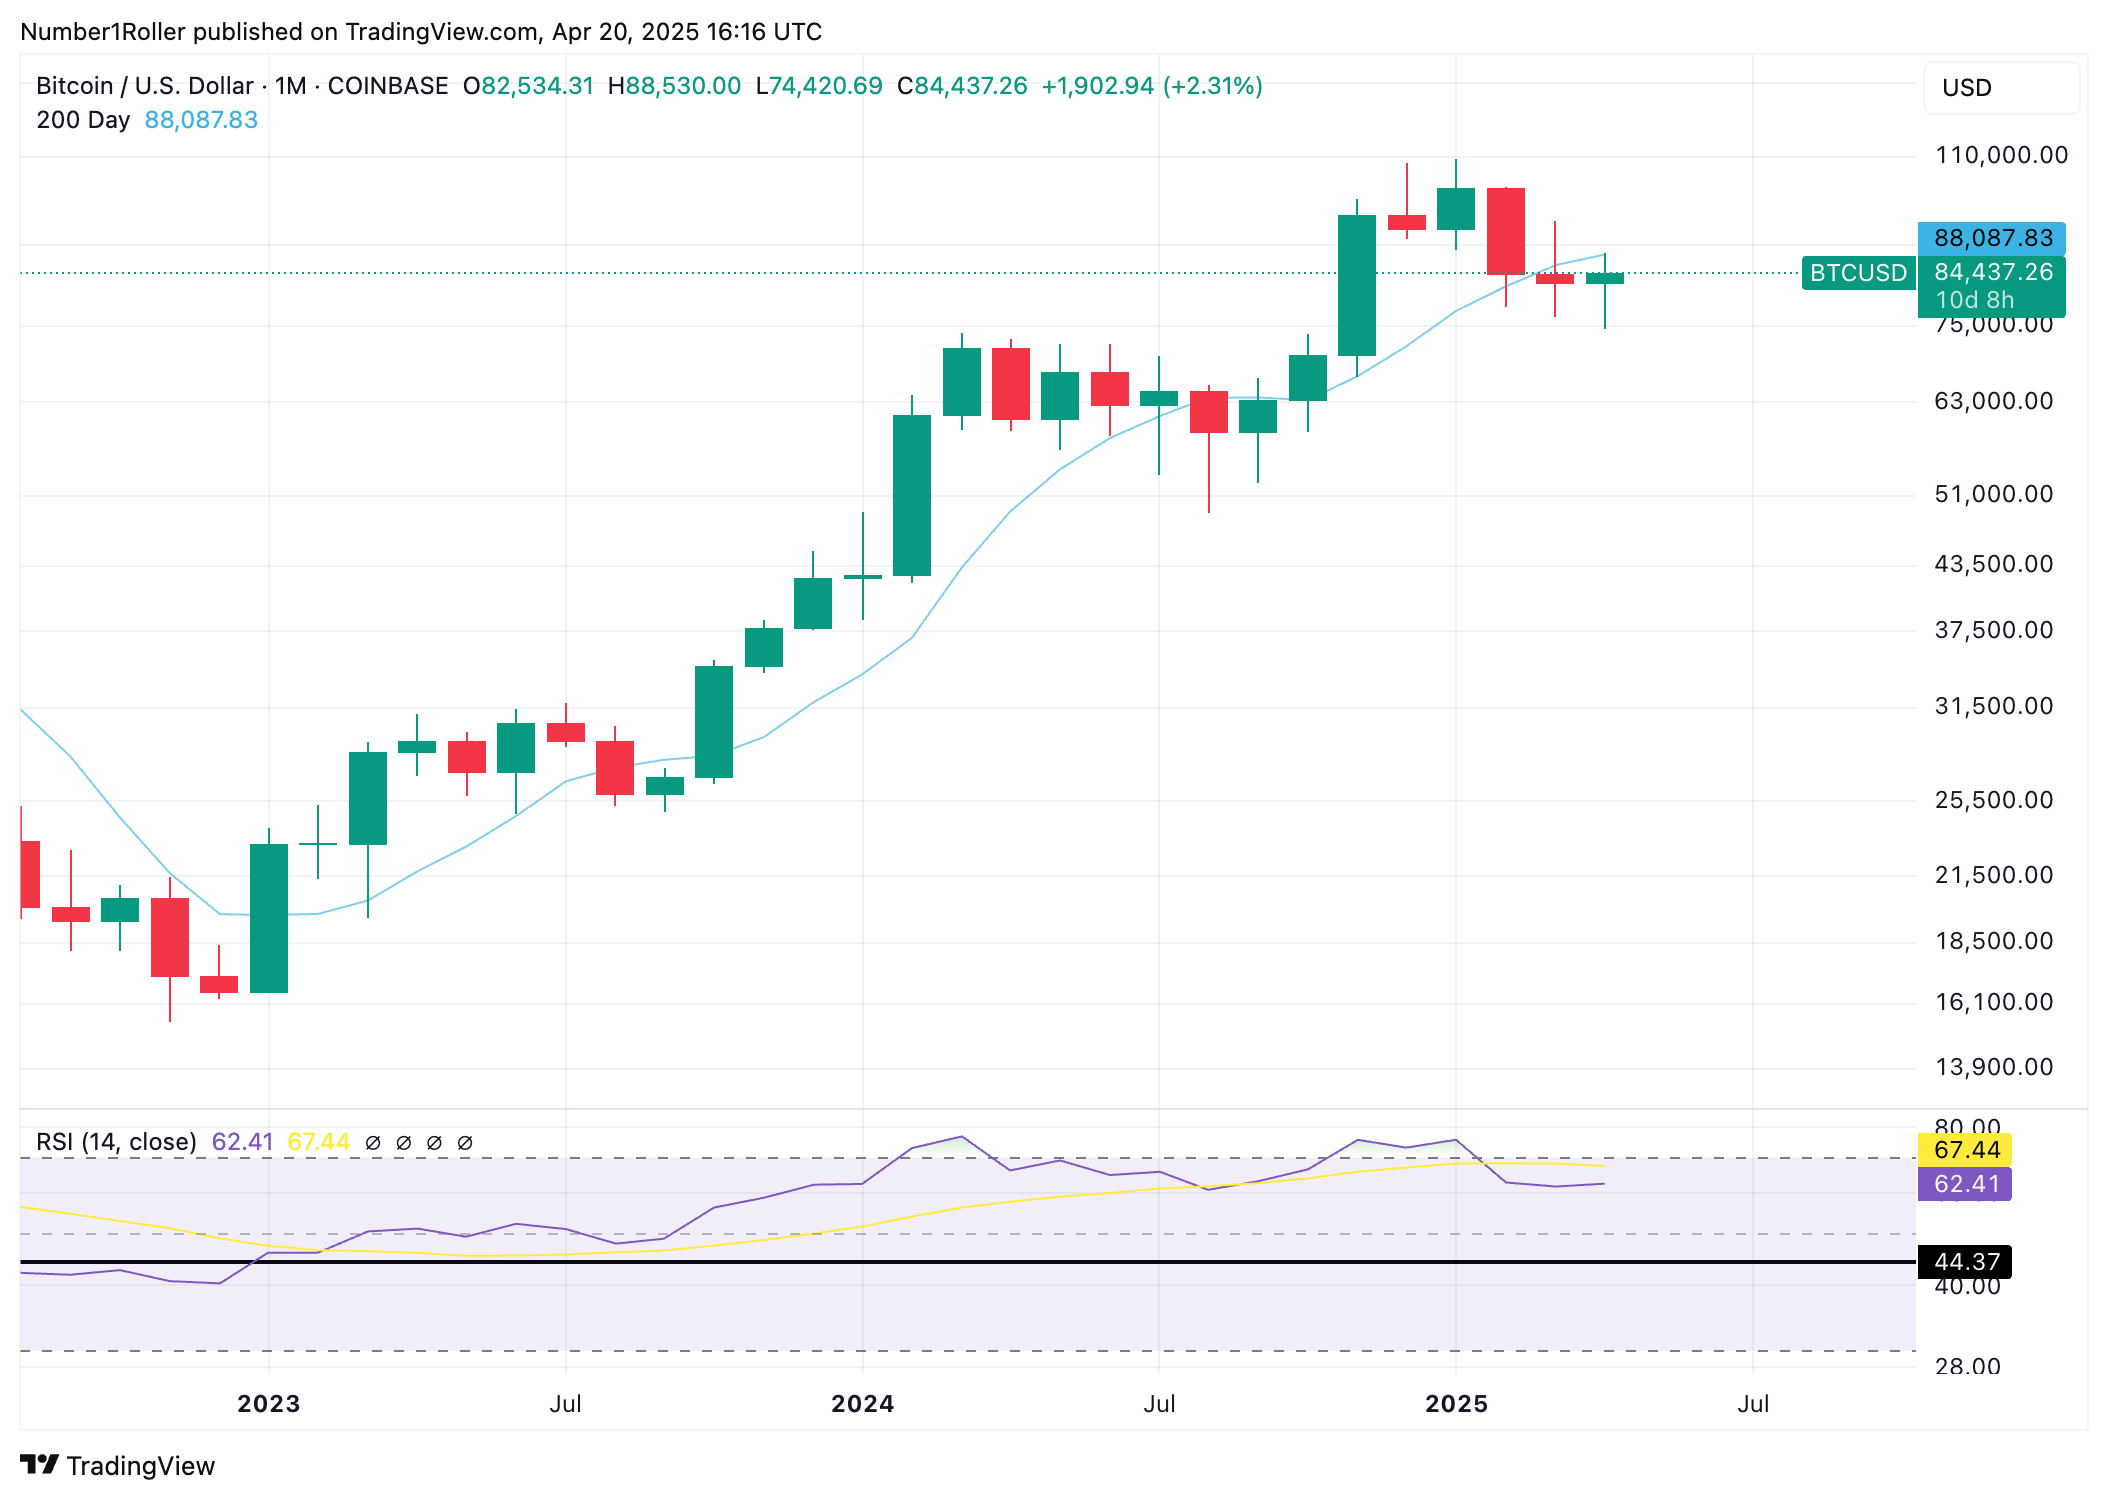
However, when we turn to the monthly we can see that we have already had two red months and if we are to remain in a bull trend (which I believe we will for reasons I will go into in the special report) then we should not see a third red month.
Meaning, I doubt another low comes because I expect this month to close green which means at least above the 82k level.
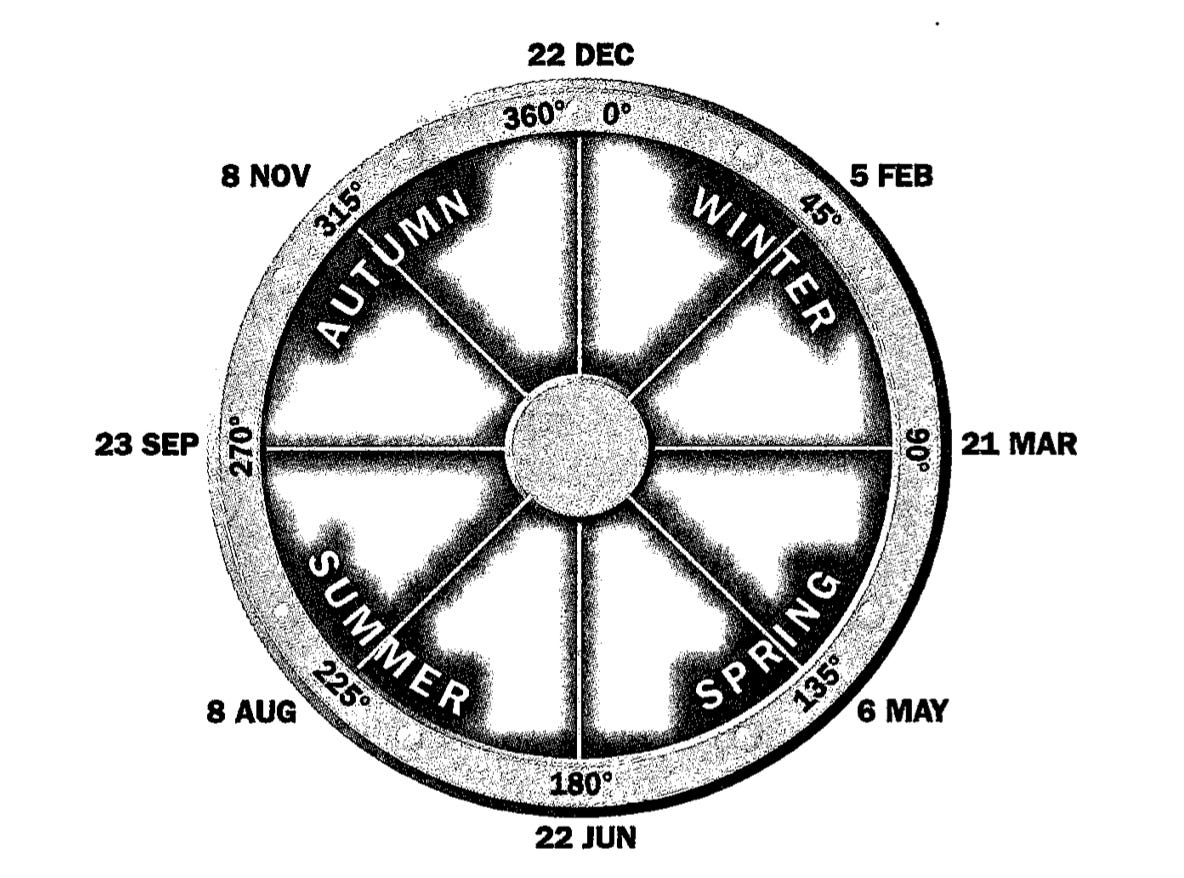
Time By Degrees and Seasonal Time
Time by Degrees
Now, when we look ahead to our next major date it falls in early May and coincides perfectly with a fed meeting which is no coincidence at all.
All times from both major and minor cycles as well as the seasonal times point to the first week of May, roughly the 3-6th.
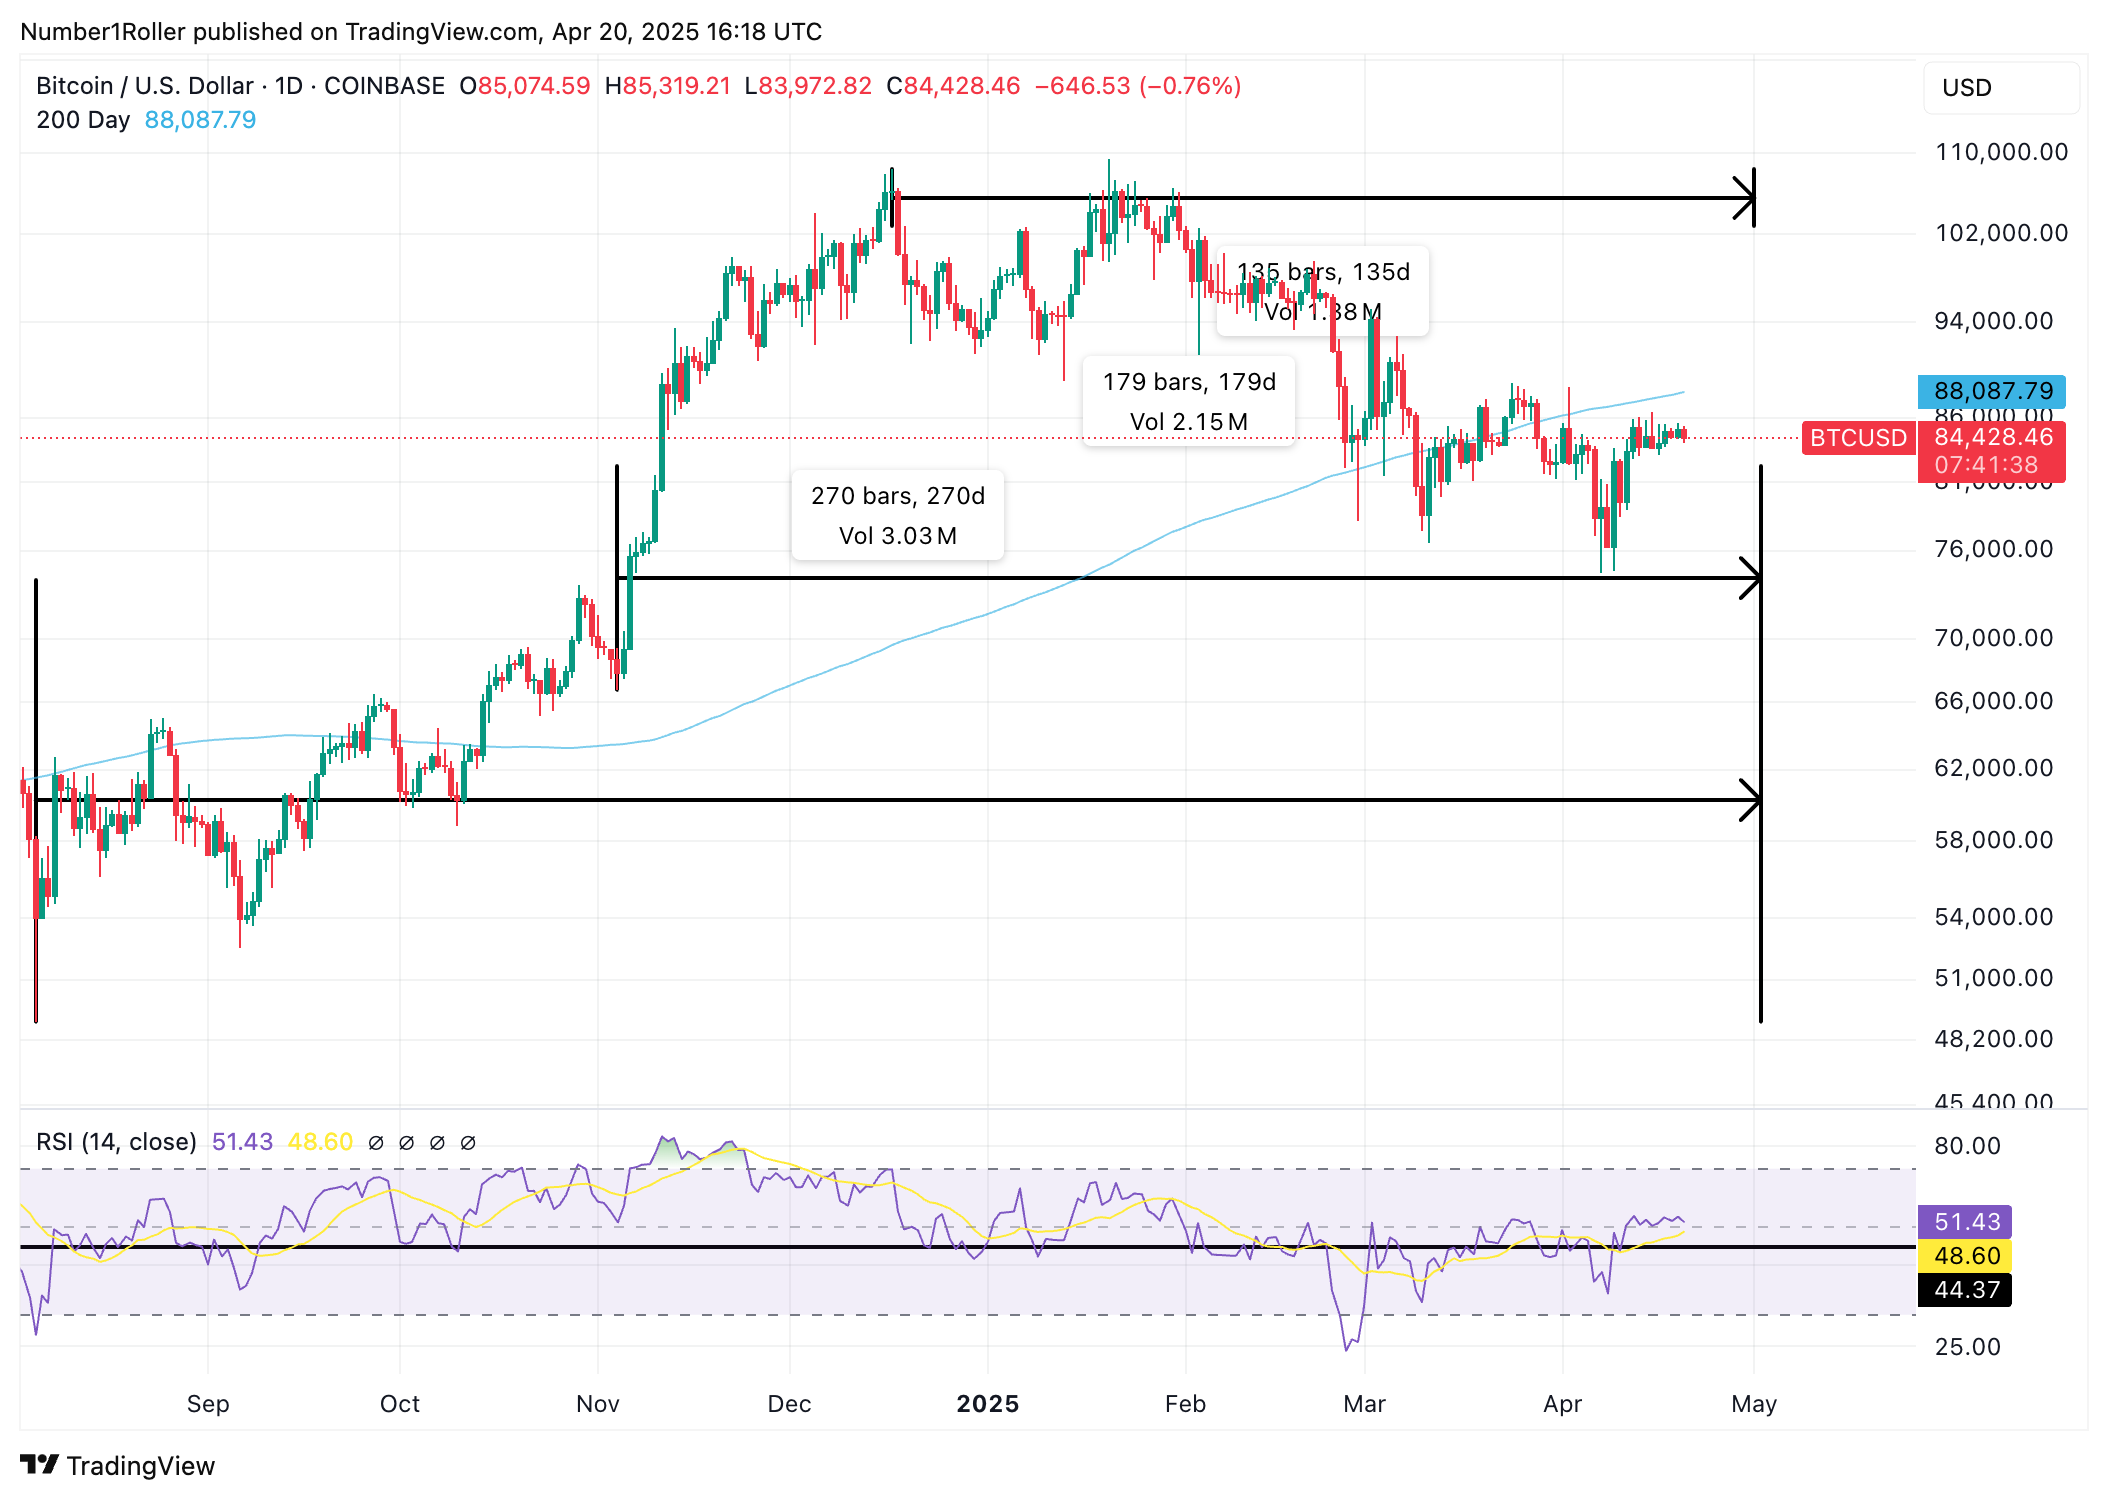
Below are the daily counts.
270 degrees from the August low
180 degrees from the November low
135 degrees from the December top which is also exactly half of 270 that gave us the August low.
So pay attention to the number 270 I’m going to highlight this very important cycle later this week as I believe it’s telling us something big.
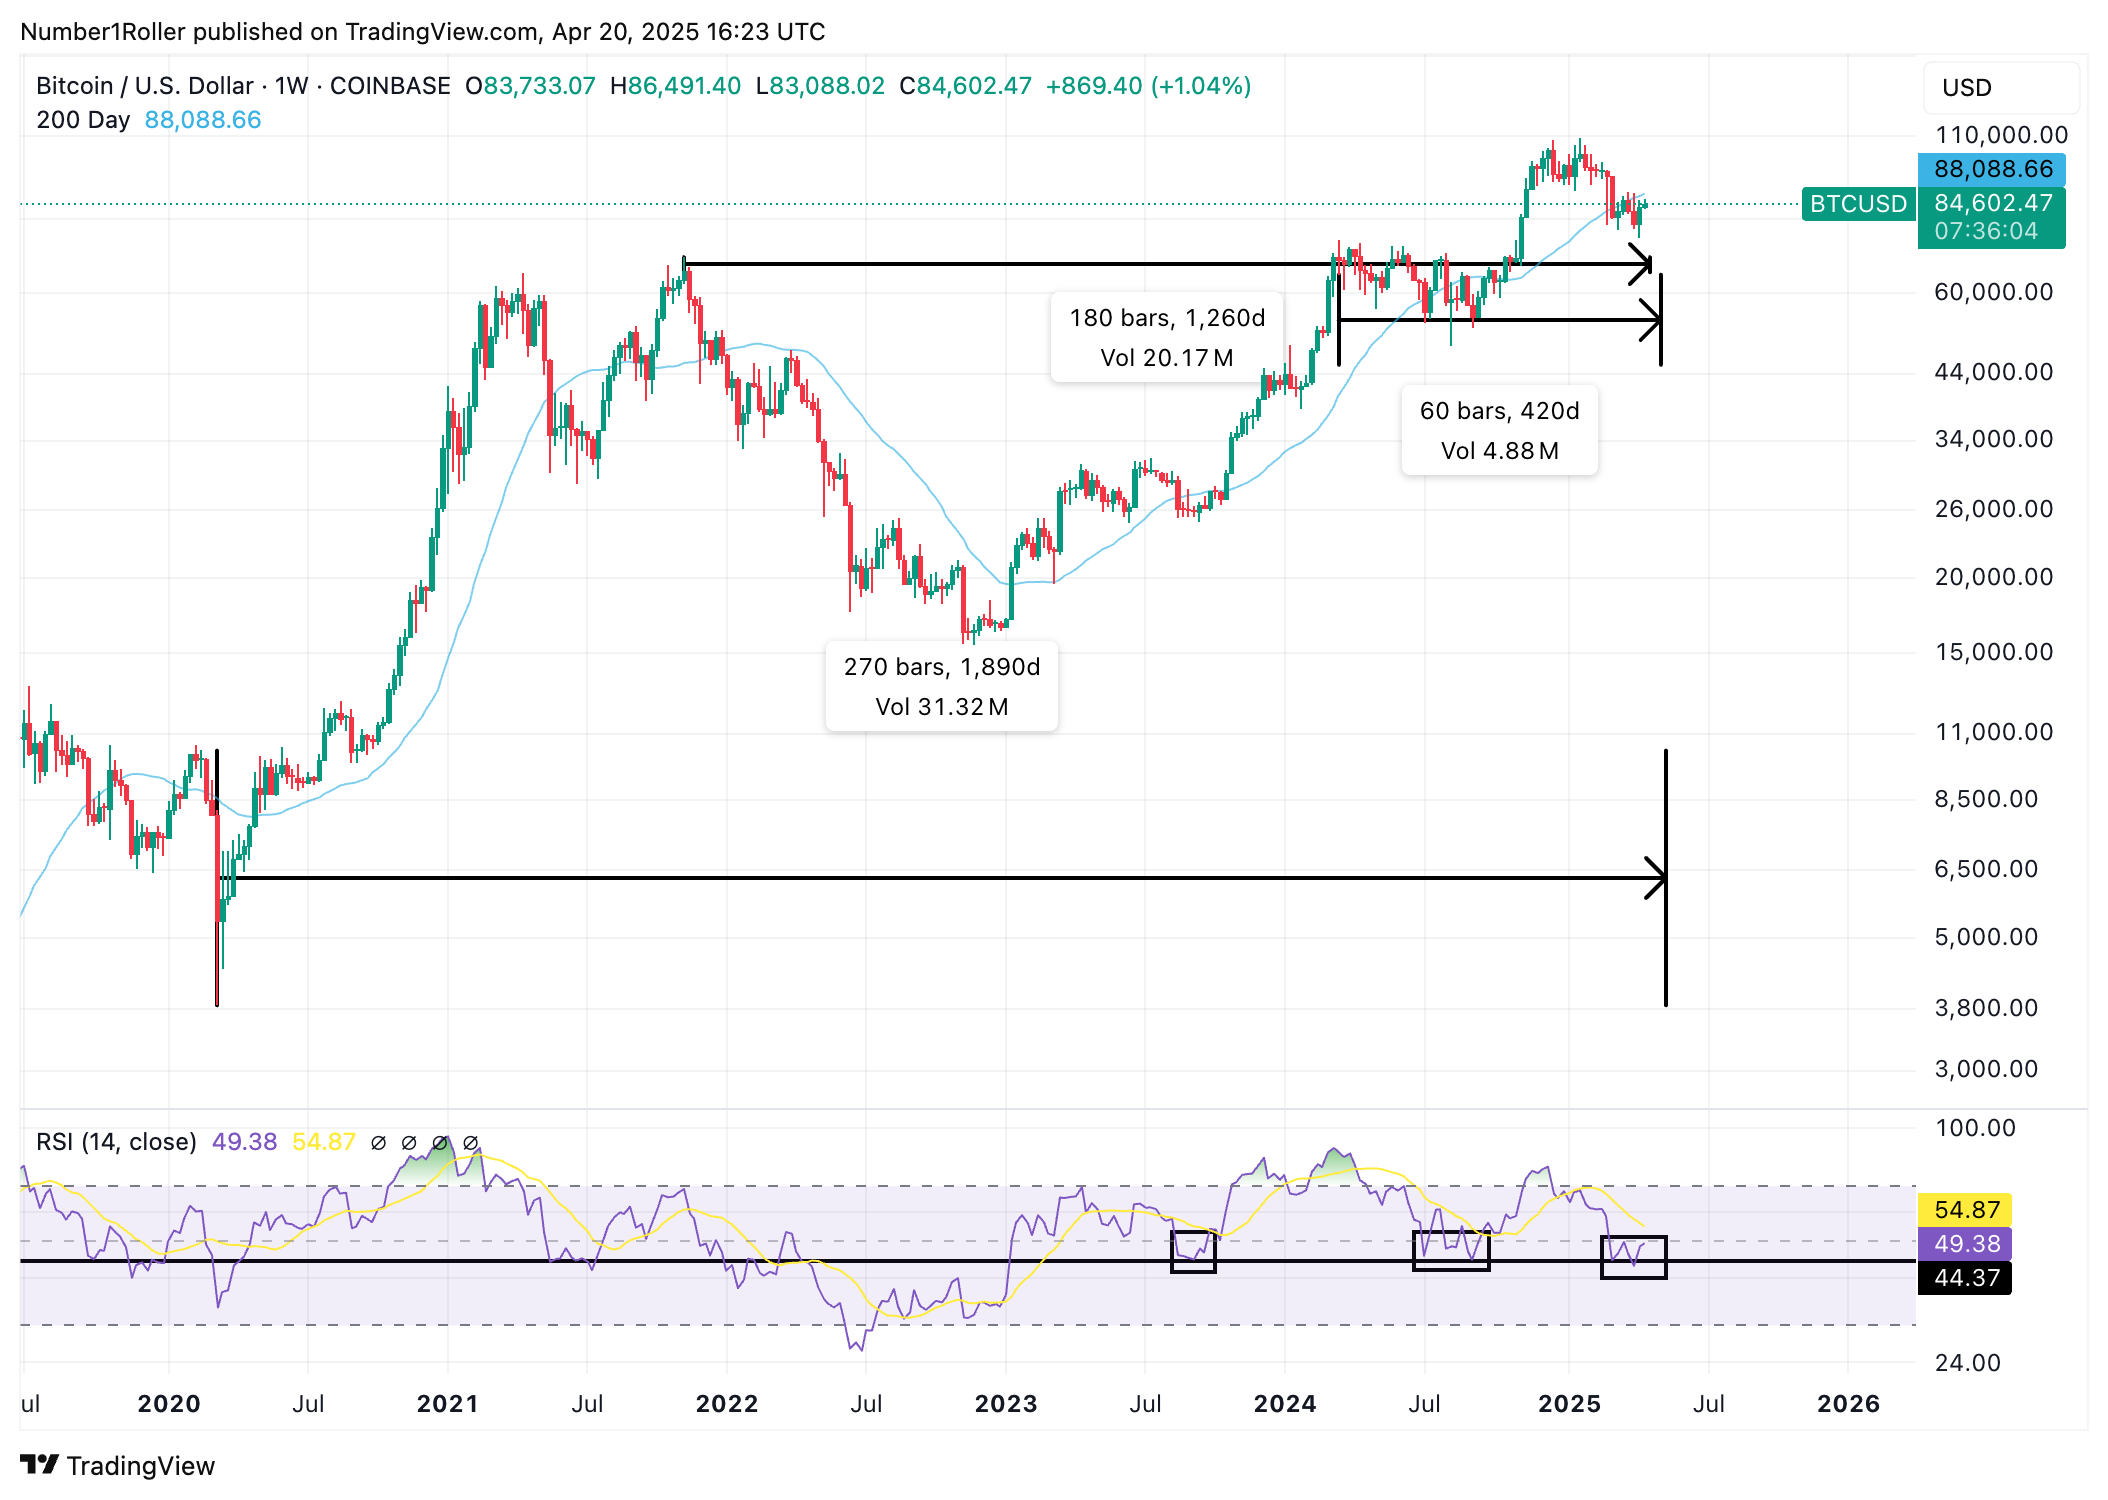
Now for the weekly cycle time counts:
Again, 270 from the Covid low. This is extremely important
180 degrees from the 2021 top
60 degrees from the high of last year.
All point to that first week in May
Seasonal Time
Additionally, we have the all important seasonal times of the year. The next one is right on our date May 6th. This lines right up with the daily and weekly time cycles I just showed you.
It also falls 135 degrees from December 22nd which was the major high that produced a double top at exactly the halfway point from the August low at 270 degrees. We know how important 50% in price and time can be so I have no doubt this will be a big inflection point in May and could possibly produce a double bottom or a the first higher low.
Finally, this all fits in perfectly to our next turning point in our 90 degree cycle off of the August low which is 270 degrees as I have been saying. The last point on the square cycle here produced major volatility on February 4th. Then we had the triangle cycle of 120 degrees pinpointing early April which, has so far, been the low. These dates have clear significance and now we are at our final one before completing this complete 360 degree cycle in late July.

The Bigger Picture
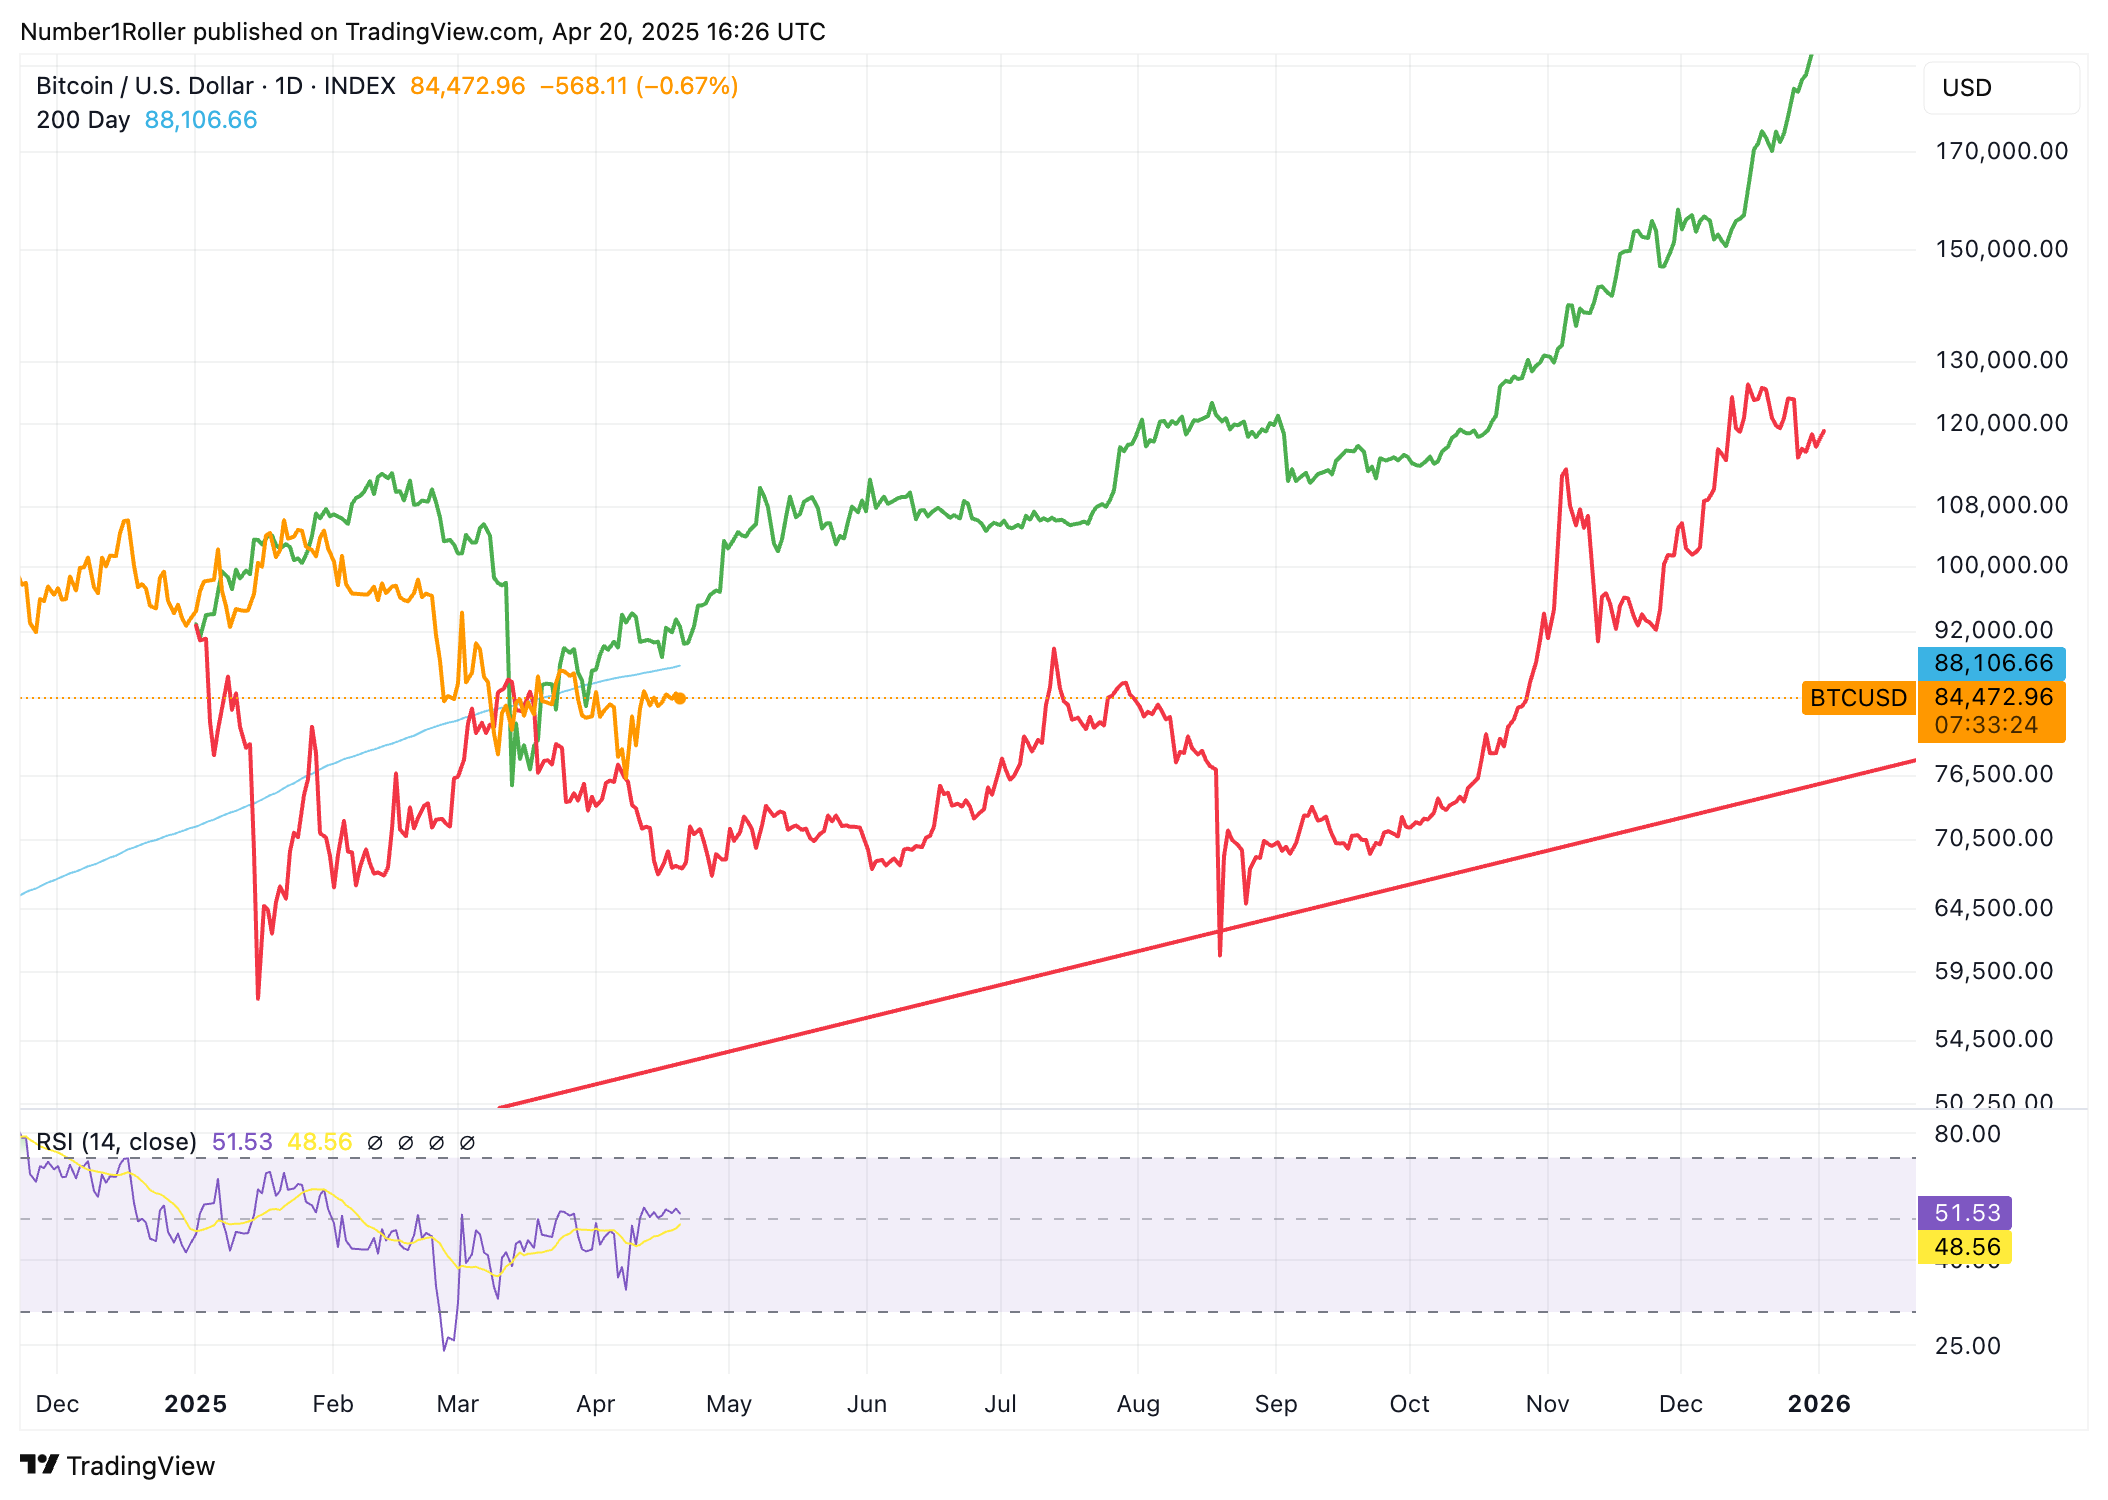
Now, I want to zoom out a bit to show you why I expect this seasonal turn time to result in a bullish period in the market until at least August. I have been hearing a lot of people suggest that summers are never bullish in crypto. But here I will show you why a bullish seasonal pattern is developing and also prime you for why I think this market has legs until 2027. It all starts with the 5 and 10 year cycles.
5 and 10 Year Cycles
We all know the four year cycle is an important and clearly defined cycle in crypto but when we study longer term cycles we place more emphasis on the 5 and 10 year cycles. As BTC develops and matures with time I believe these are of increasing importance and relevance.
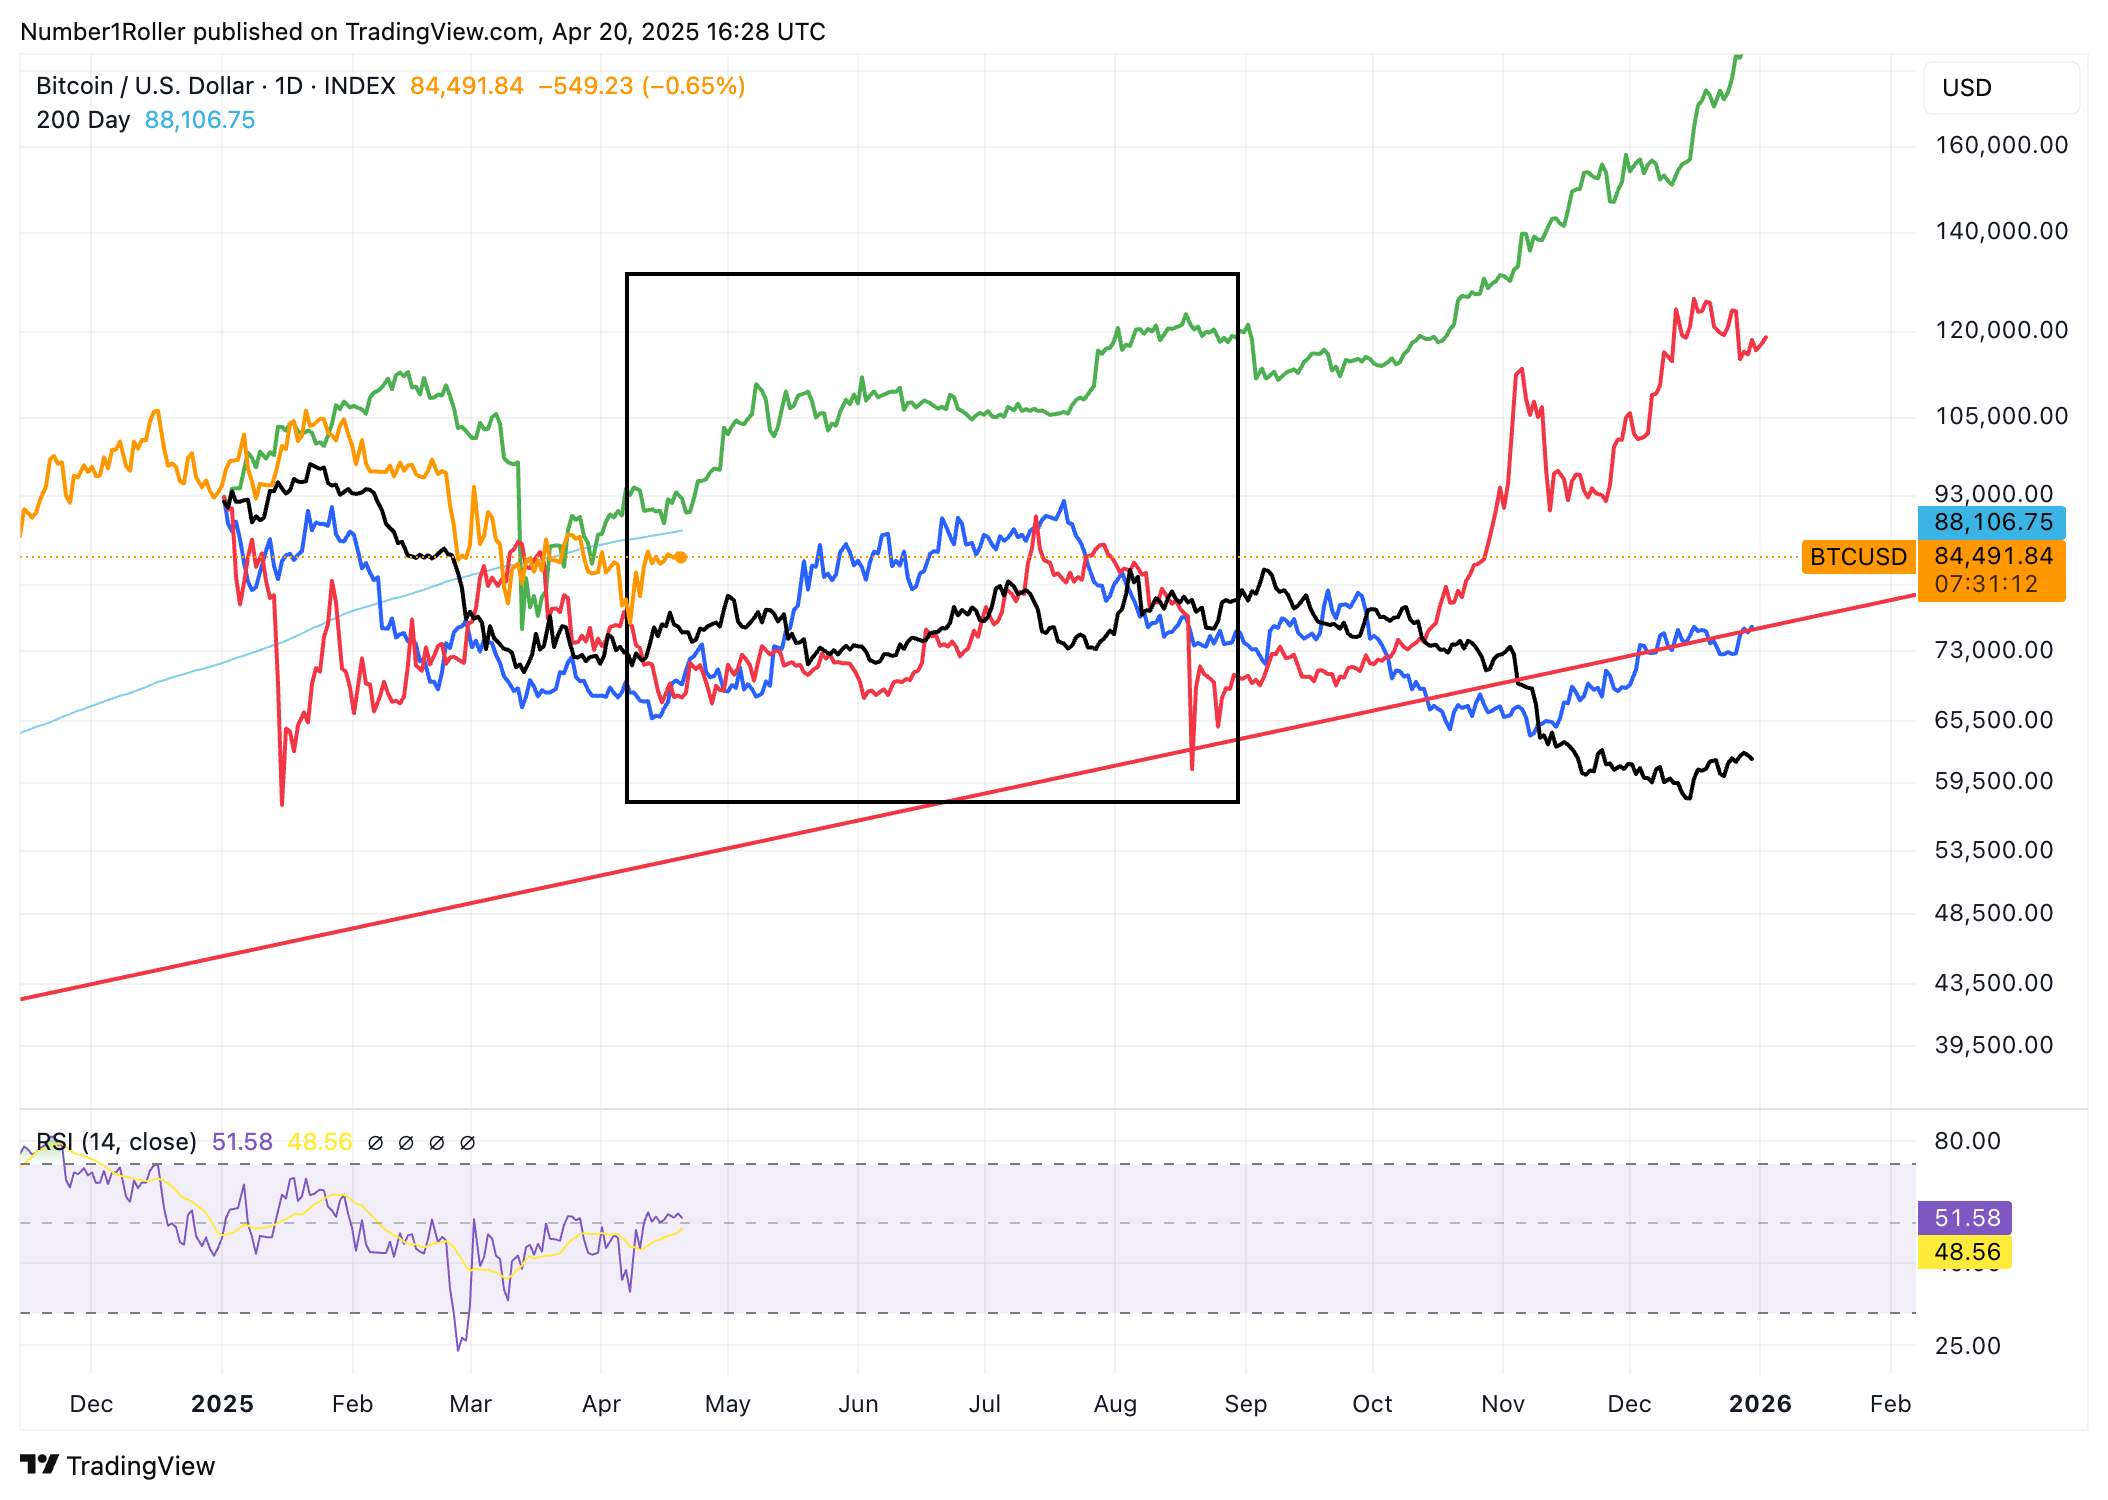
Below you can see these two cycles. 5 year cycle is in green, 10 year cycle is in red, and current cycle is in orange.
What these cycles suggest to me is that
A) the low has been made in April
B) we are in for a bullish upswing until roughly August BUT the market will likely be very boring until at least June, then the big move comes.
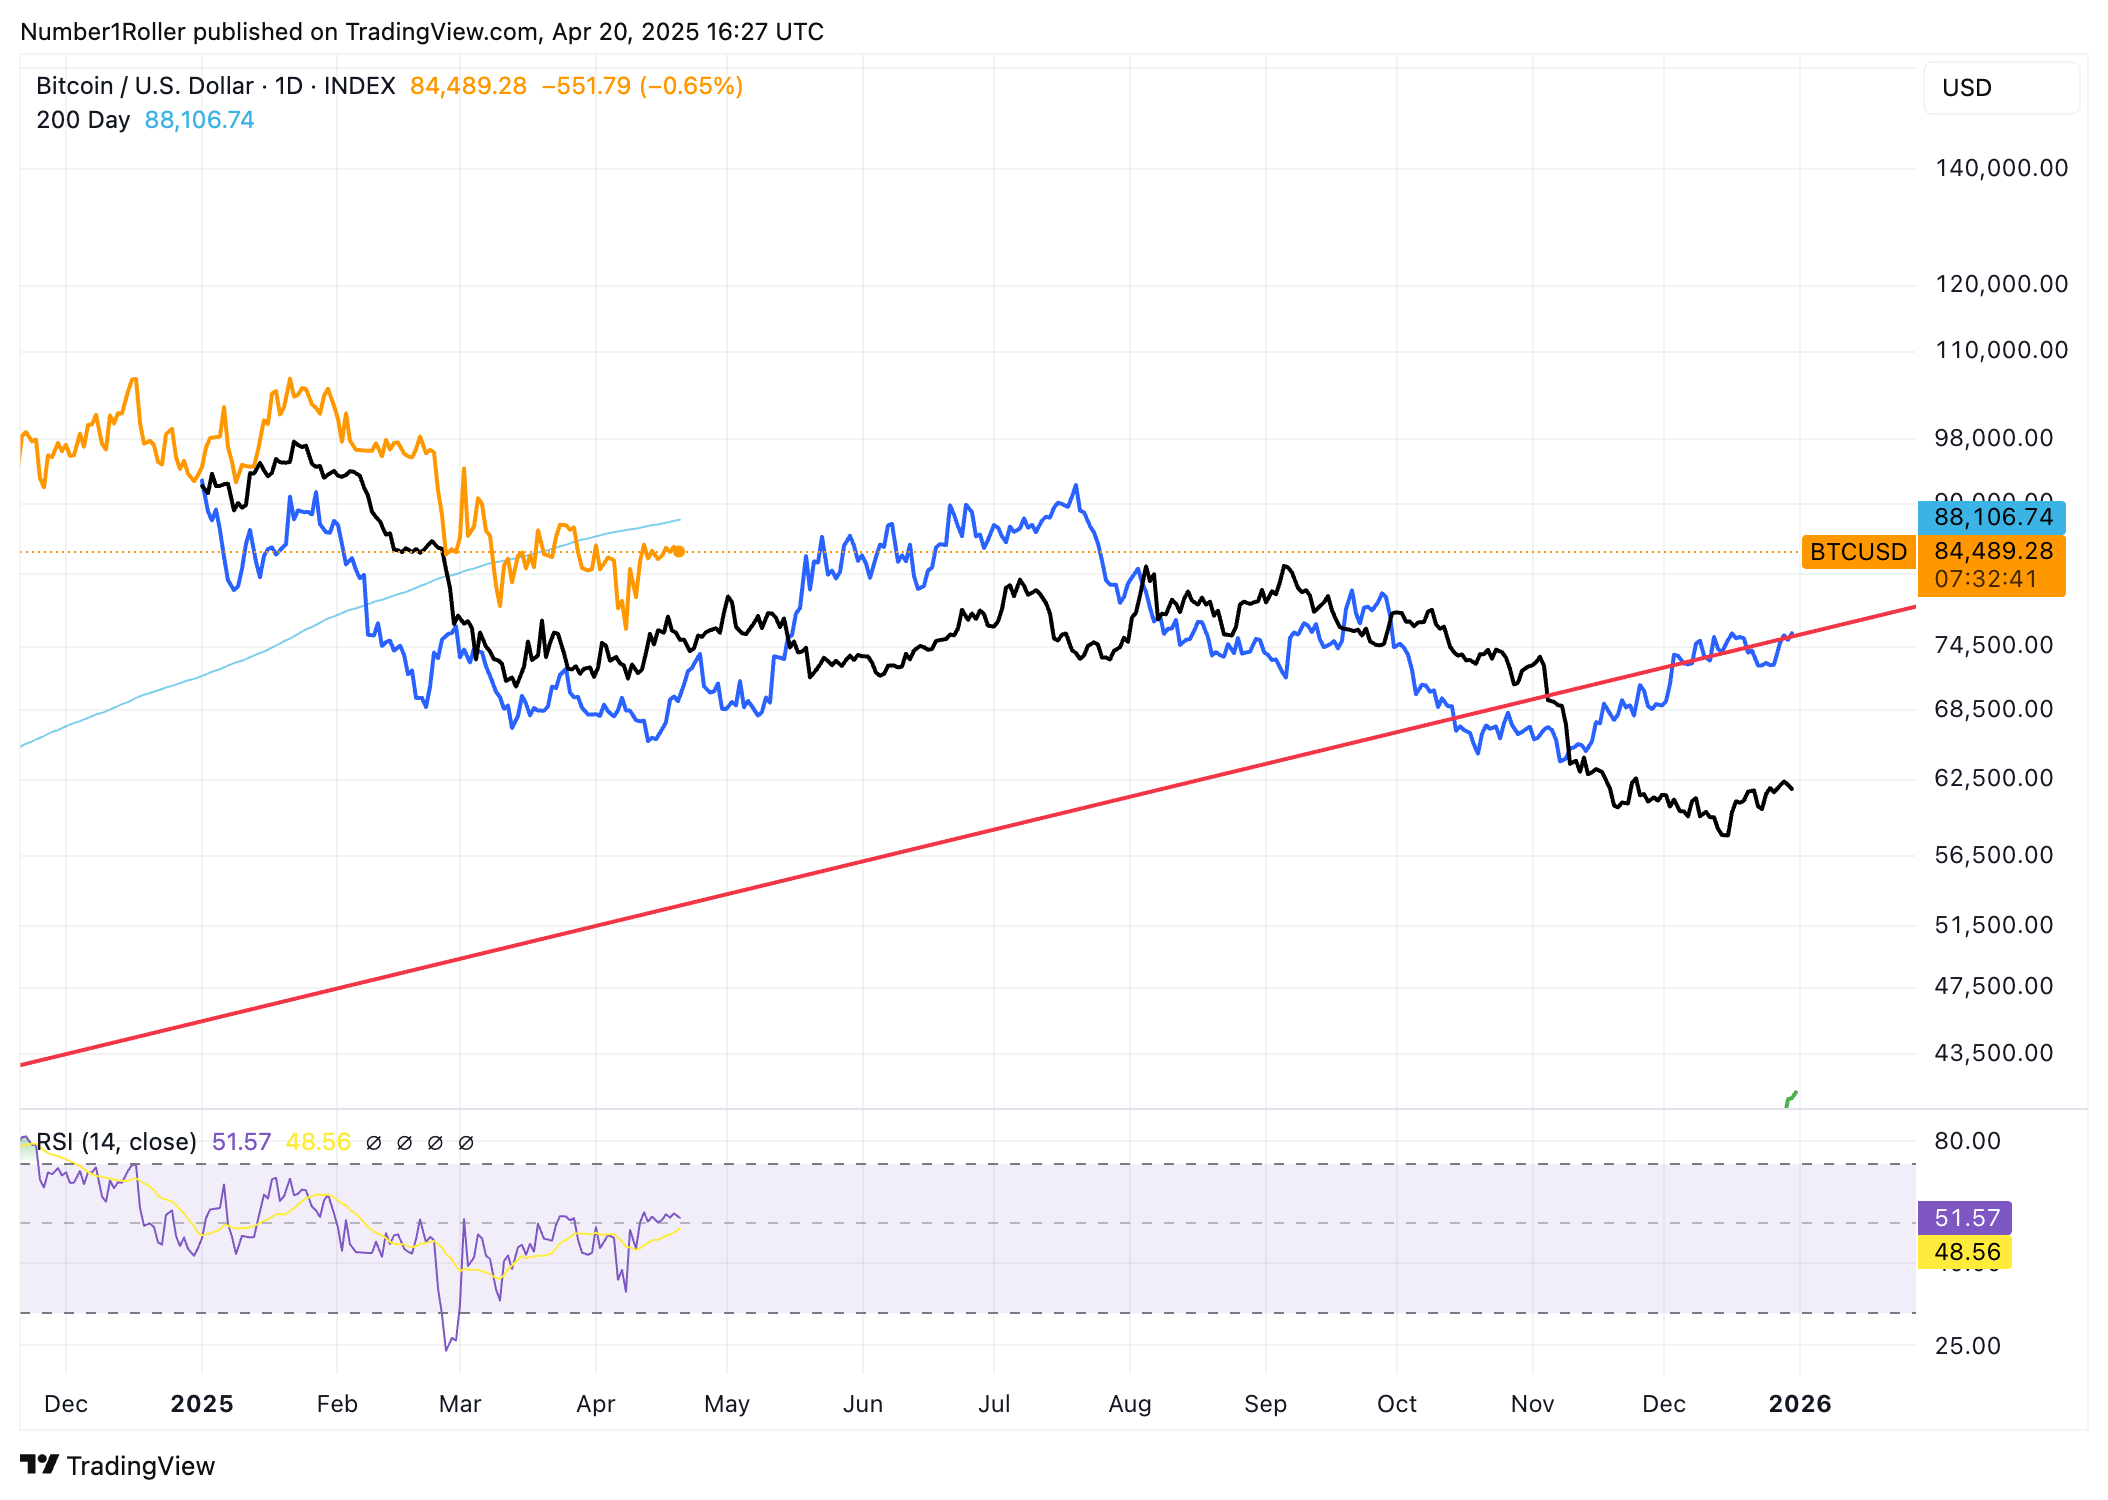
1 and 4 year Cycles Inverted
Furthermore, looking into the 1 year cycle in black, and the 4 year cycle in blue, (both are inverted) we can arrive at similar conclusions
A) the low has been made in April
B) We are entering a seasonally bullish period in the market into August BUT againg, the bulk of the move won’t start for a few more weeks.
What to Expect
In short we have our next key date which is no doubt going to be a big one around May 6th. I expect it to give us a signal that the bottom is in fact in and we are beginning a bullish period. However, I also believe the market will not take off to the races any time soon and we are looking more into June for things to really start heating up.
Remember, the next fed meeting just so happens to be on the 7th of May so you can see, these things are all preordained.
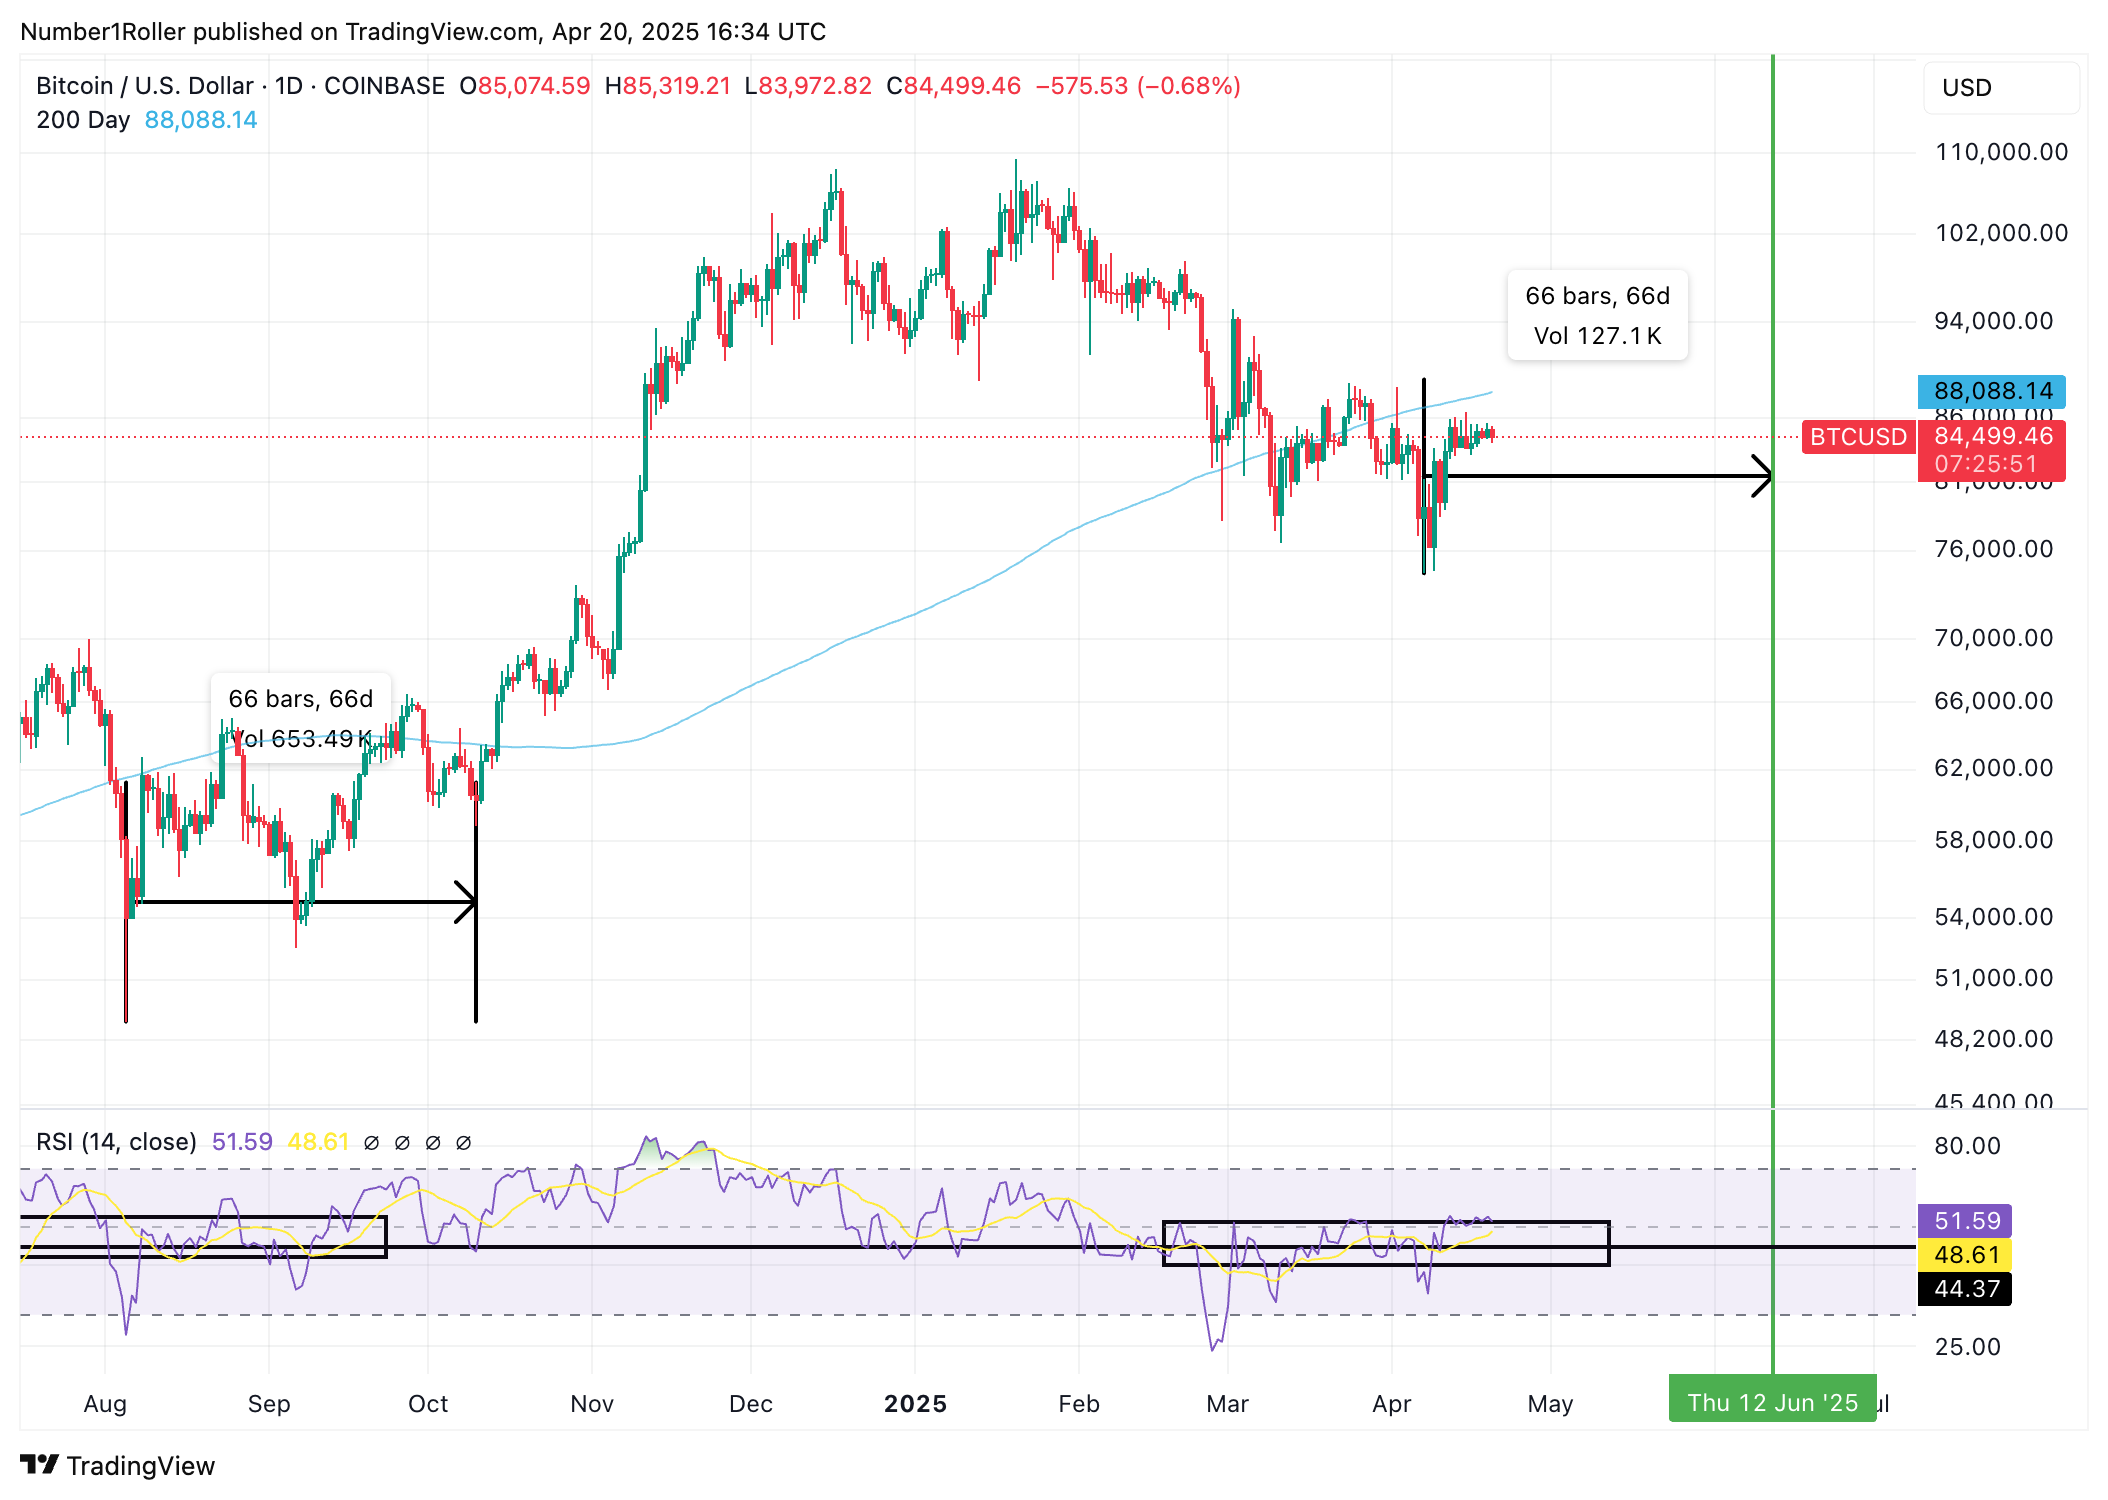
Now, I said back in March to watch the 9 week consolidation period we have consistently seen this bull run when the market hits certain parameters. Those being the weekly RSI level, price below 200 dma, and all happening while at the bottom of the macro channel. Those 9 weeks are up right on the first week of May.
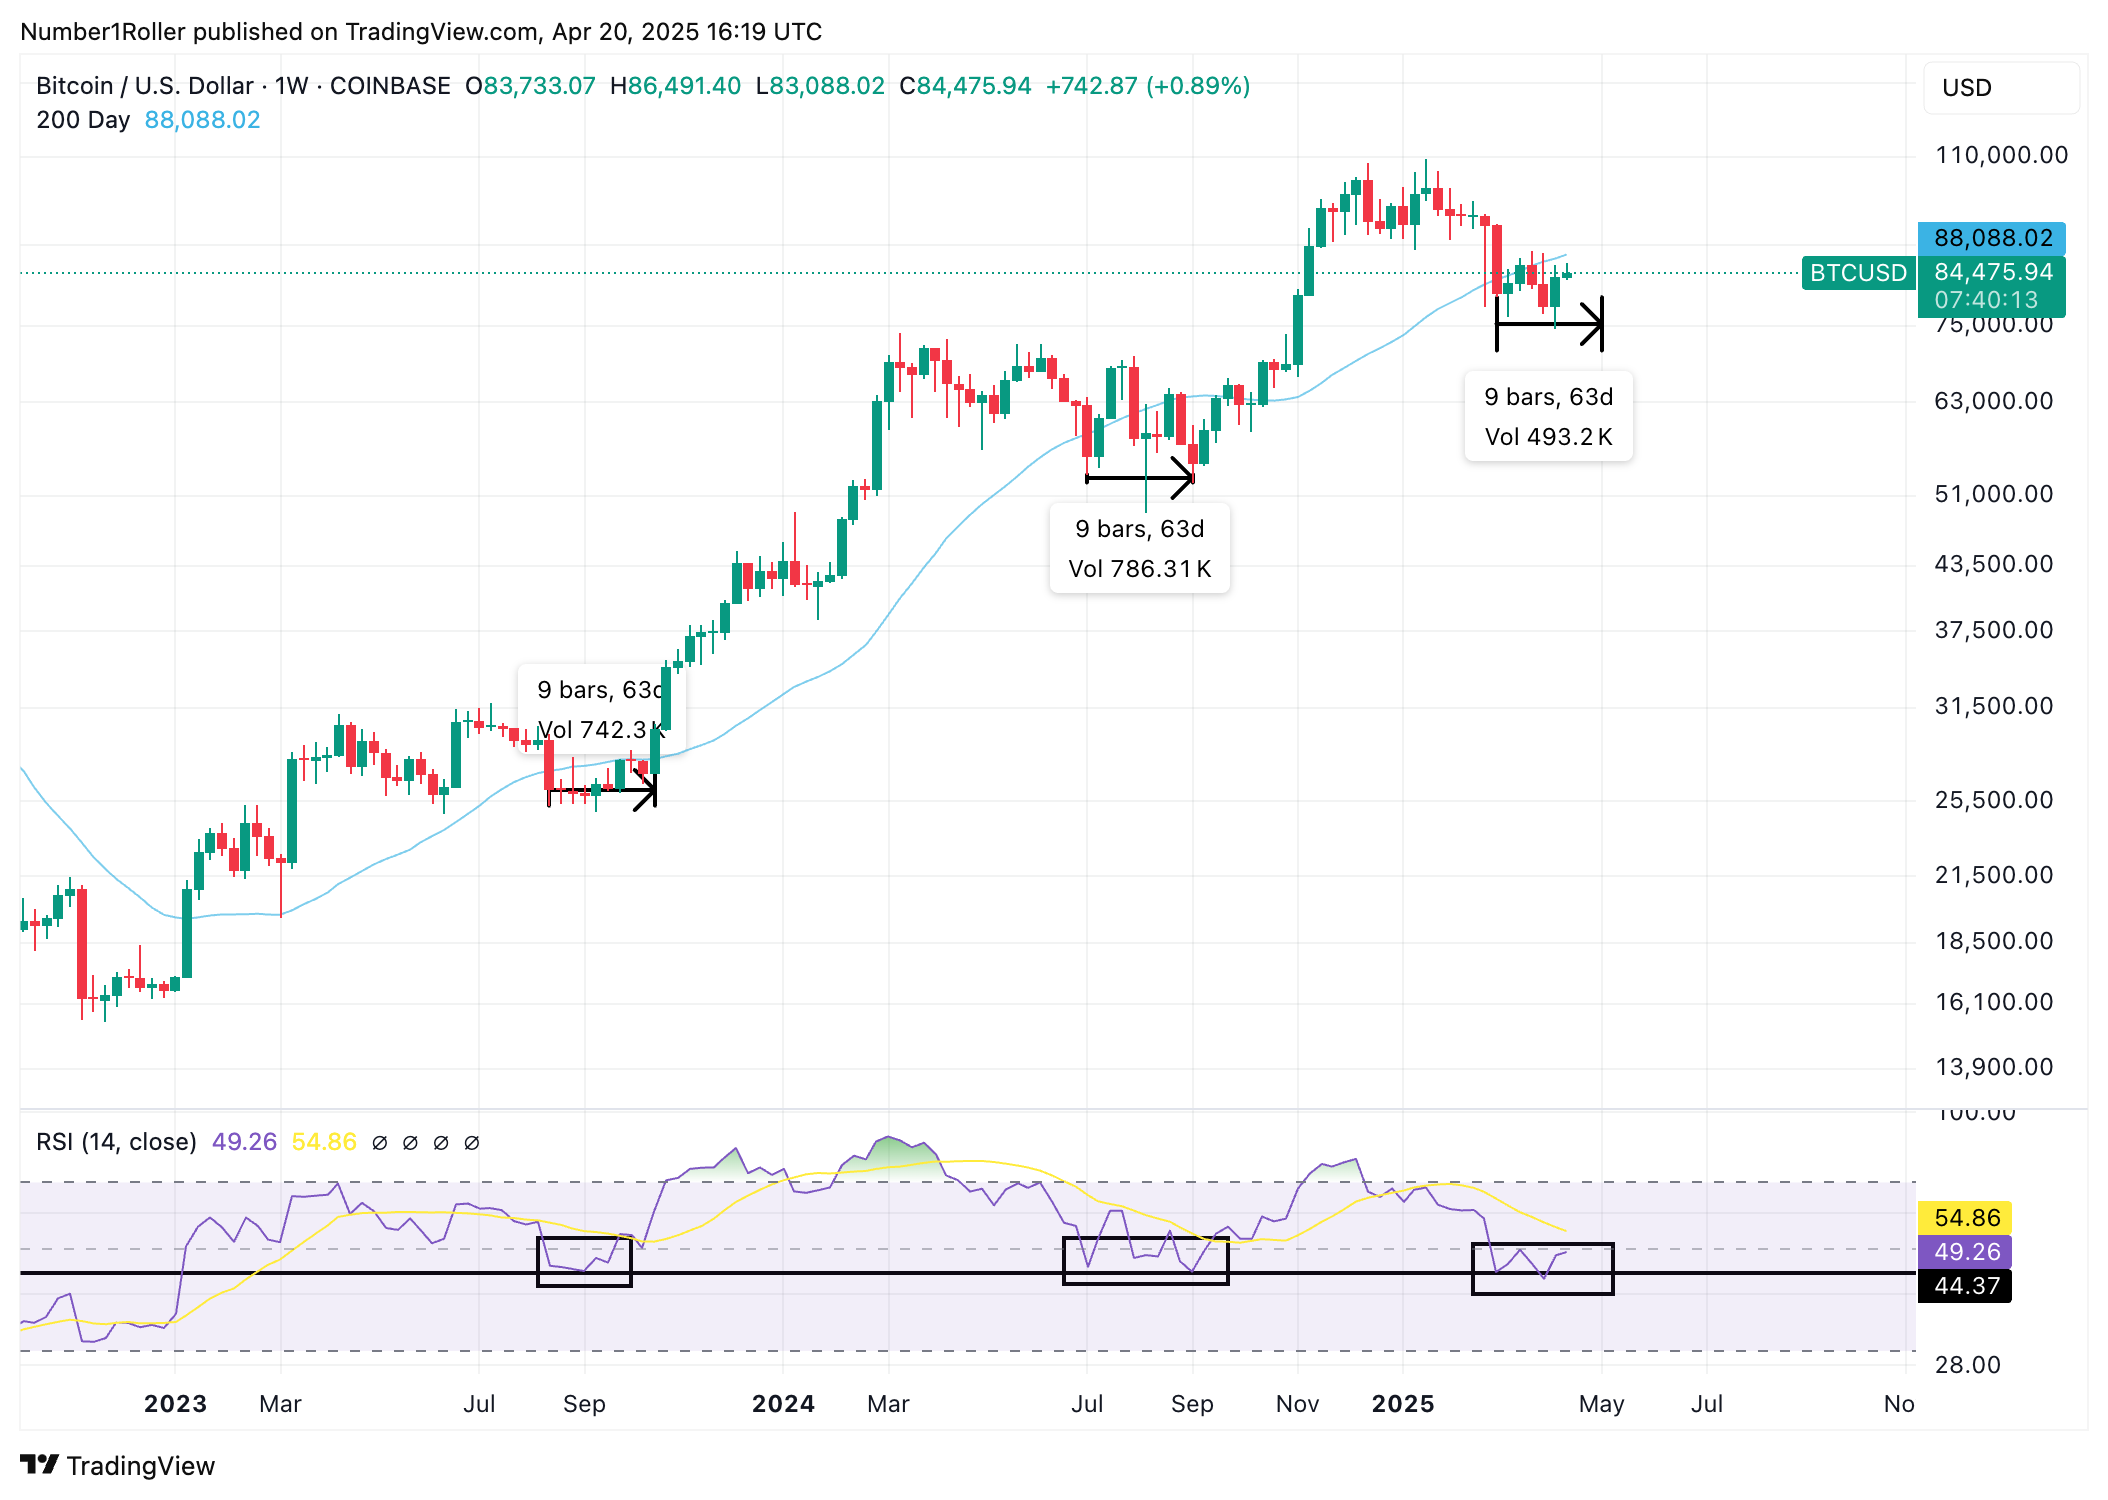
Also, note the August low and the following price action. The low was in fact in but it took 66 days to confirm the second bottom out. That whole time price was up and down but it really didn’t get explosive until two months after the bottom.
This lines up perfectly with a bottom being in but a big run not starting until June. So again a grinding market is what I expect for May but the cycles and seasonal patters say no more lows.
Lastly, putting all the above cycles together this is the picture you get. I do believe these are the most important cycles to watch this year and they all essentially point to the same two things. A low early in the year, which has been made, and a bullish seasonal pattern starting now into late July and August.
This is the framework I am using for the next several months. I believe I have some very compelling cycle work to show you around the five and ten year cycles which will prove that BTC is not ignoring the cycles it’s simply maturing into more important cycles that have always been there.
For now, I have laid out substantial evidence of a seasonal change time aligning with daily and weekly time by degrees, as well as the 90 and 120 degree cycles, all the way up to the 5 and 10 year cycles. Remember the number 270 it is of major significance here but I will cover more on that later.